Processing Notes
Location: Riet Vell
Author: Angèlica Busquets Rubiés
Date: 2026-07
Processed period: 2025-09-04 (247) – 2026-06-30 (181)
Code: Met
For the first steps of met data processing, we use python package BGTL-FLUXY for the first time.
Since we now have slightly different Met30min structure (using the fluxy log-append), we had to change MeteoRV script to define headers as headers= A.textdata(1,2:end); (Column headers are the first row of textdata. We skip the first column because it is datetime).
With Qin we realised that fluxy causes ‘Time’ to be 17.0, 17.5, 18, … Instead of 1700, 1730, 1800. For this reason, ‘Time’ definition in Matlab is not adequate. We can see that in the following graph:
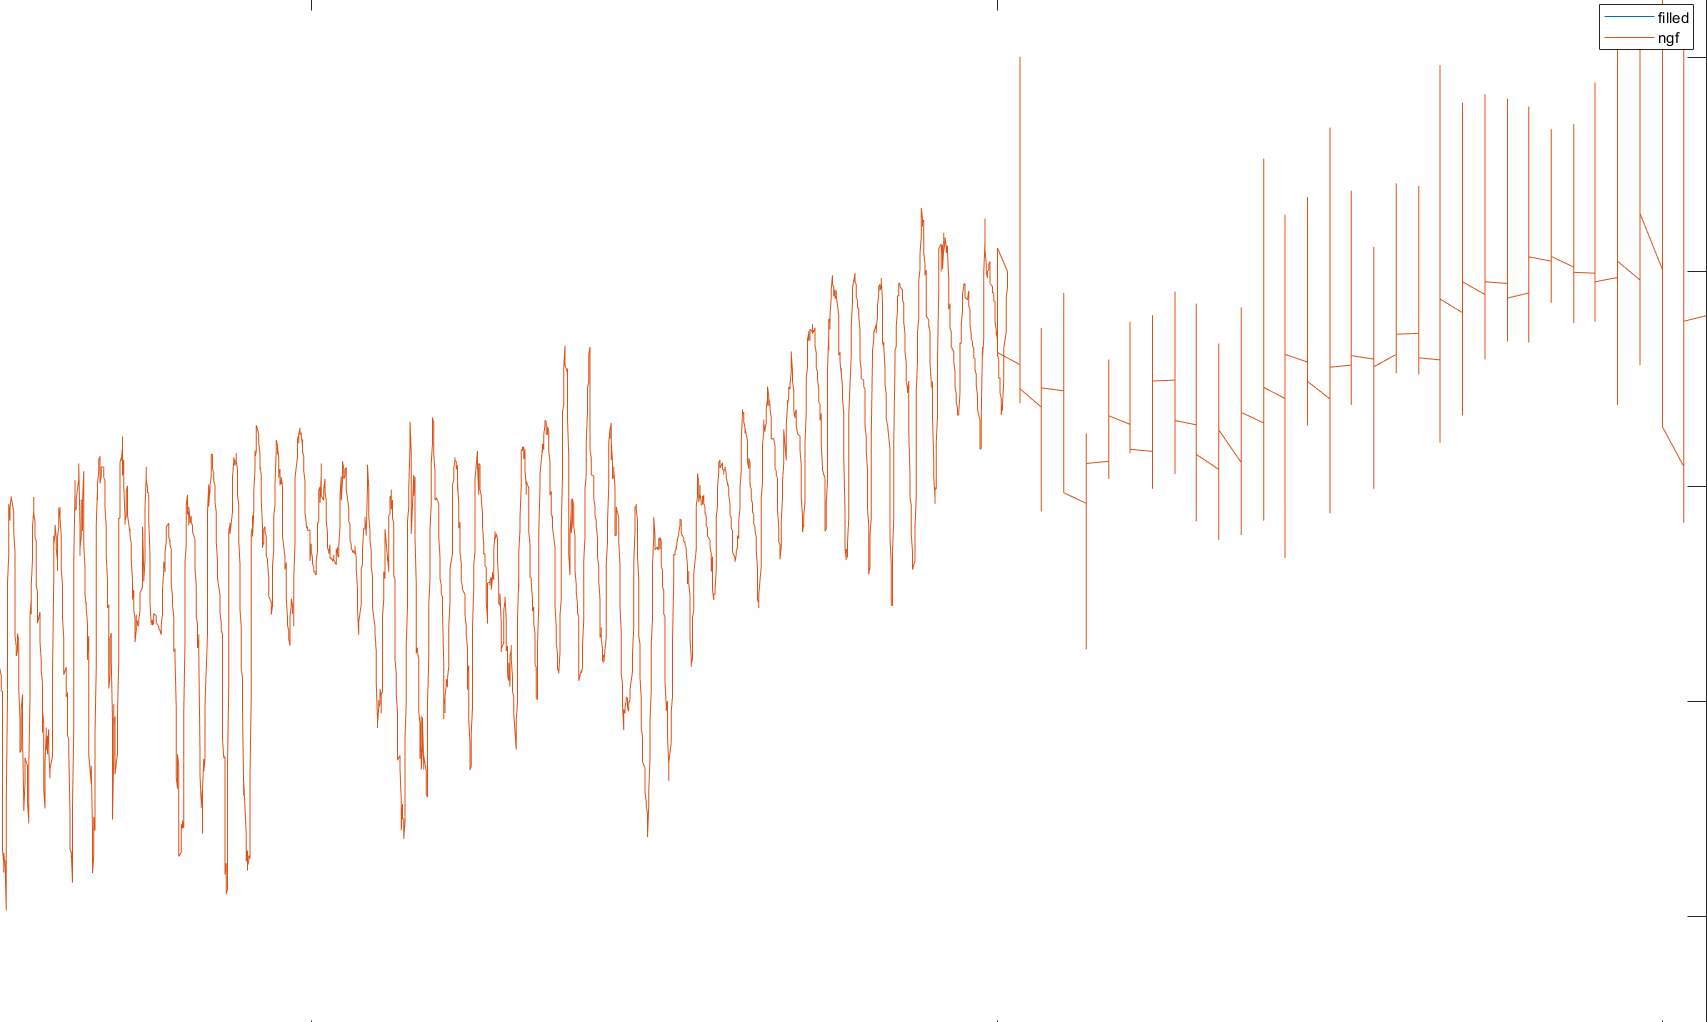
To fix this, we run fluxy – – log-format – – add-doy, so all data is in decimal format. In MeteoRV we then changed from HH=floor(Time/100); MM=Time-HH*100; to HH = floor(Time); MM = round((Time – HH)*60);.
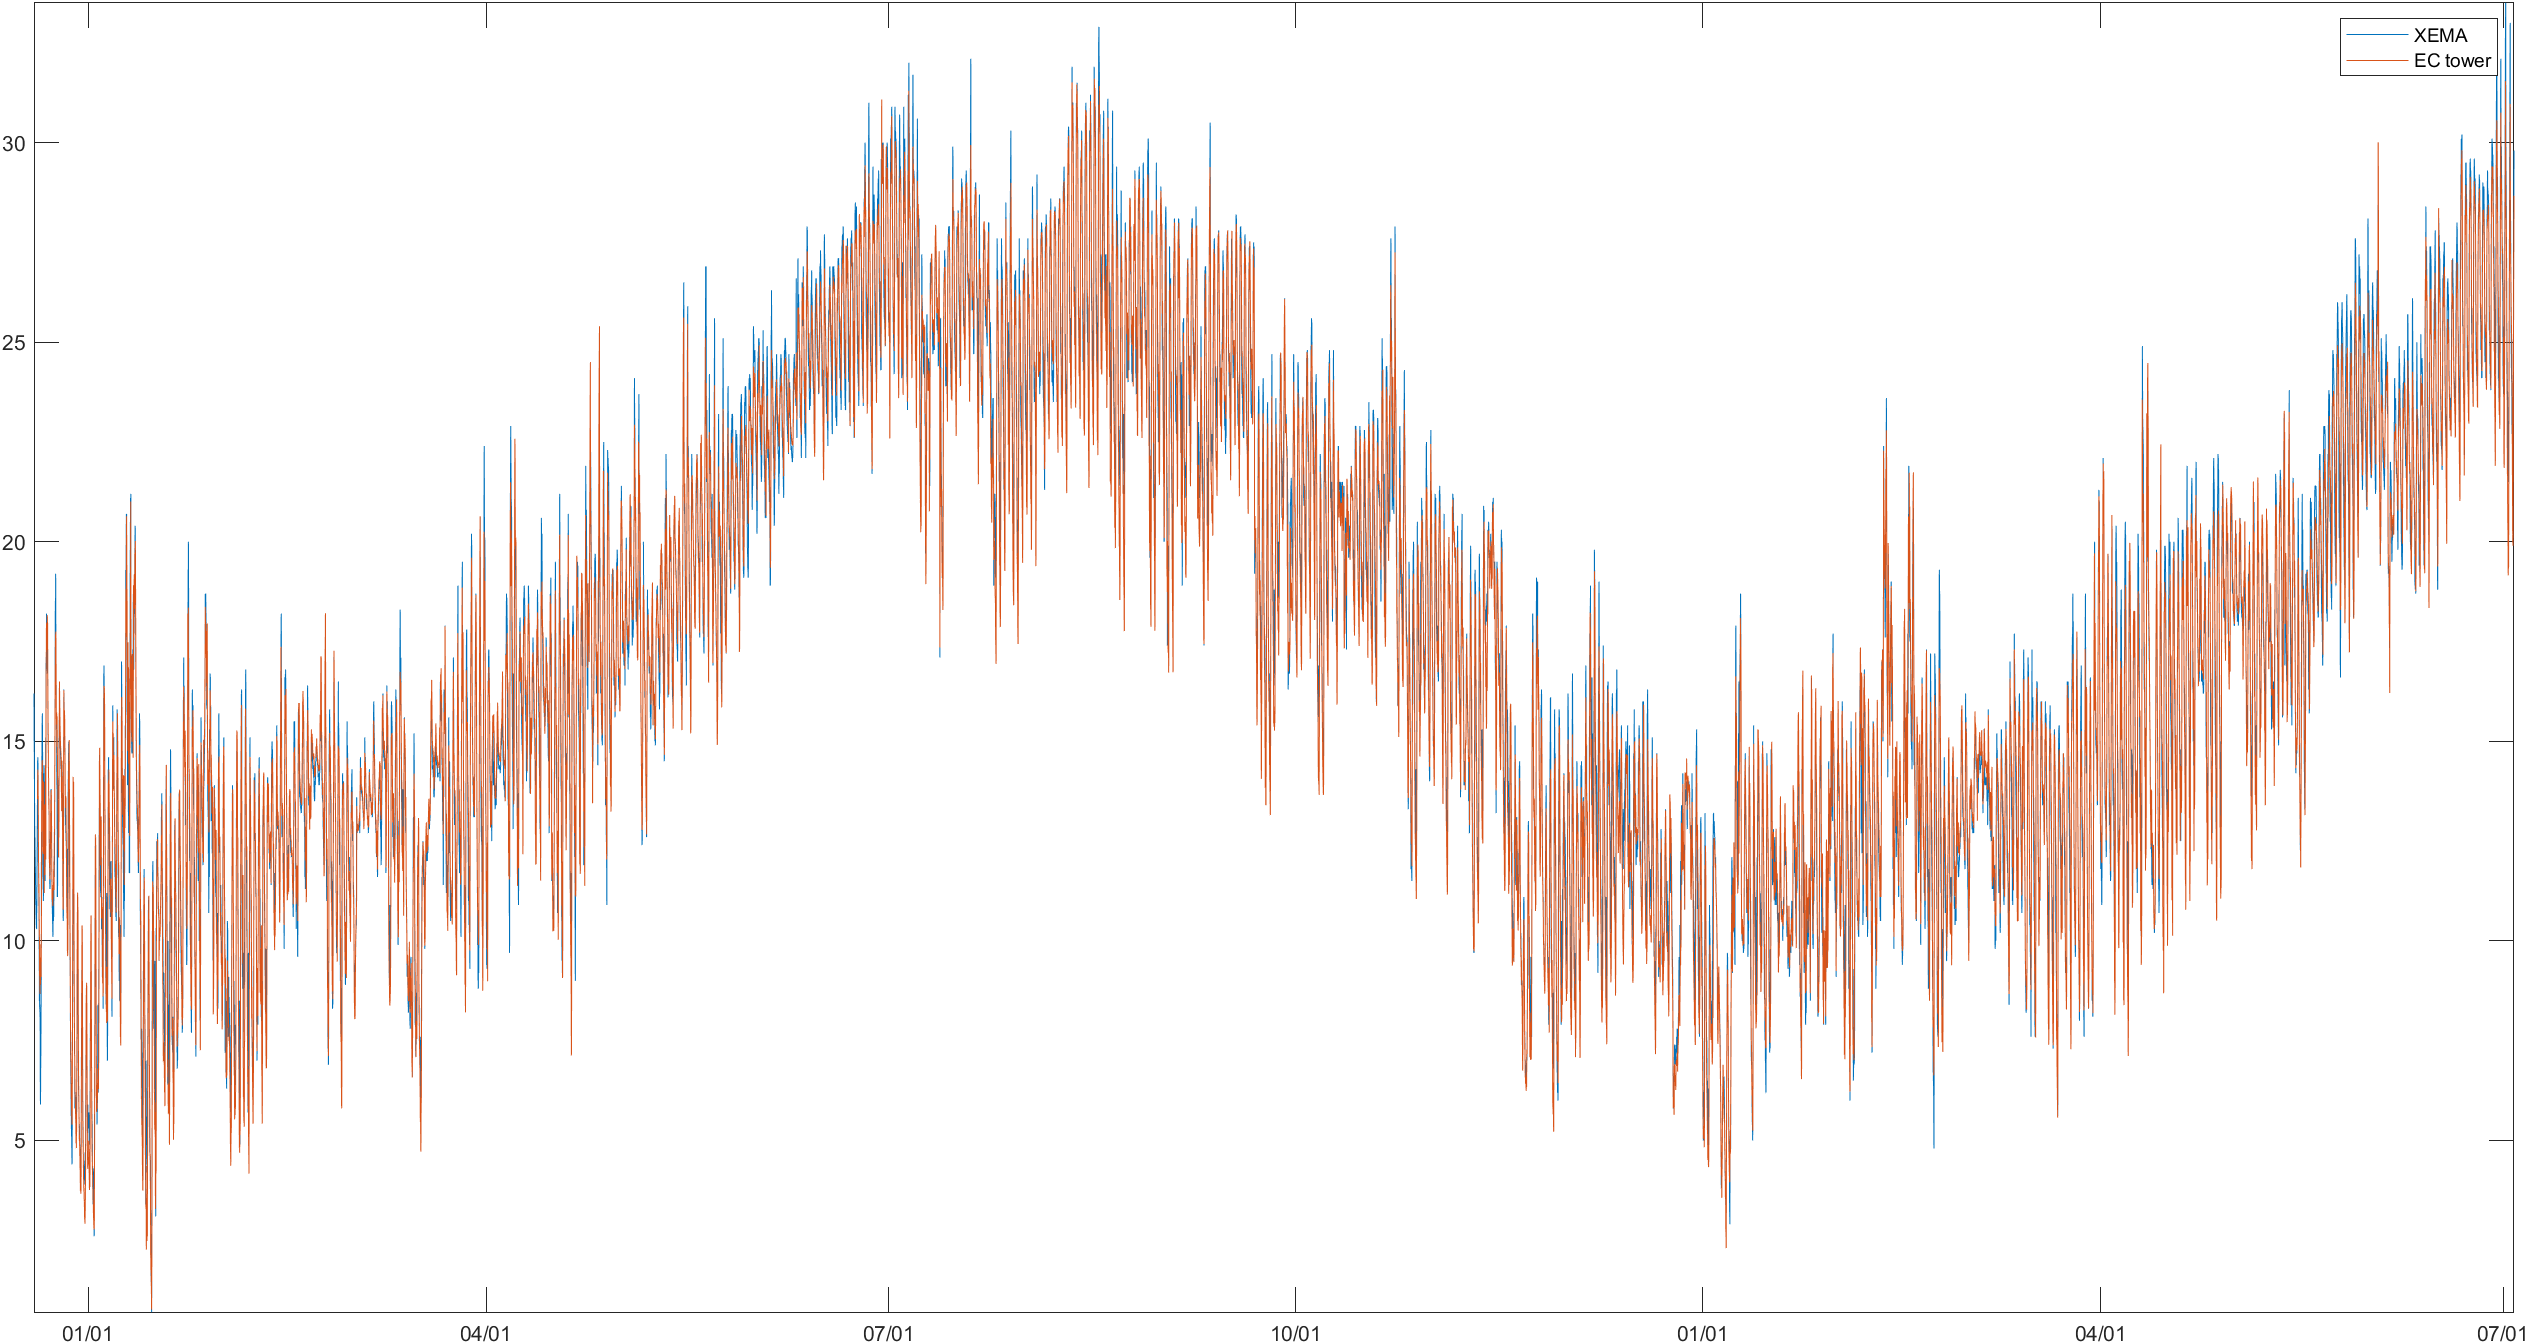
From now on, that we have several months of data, when using xema to fill our data we will only pick a 3 month period surrounding that date (+-45 days), so the correlation between our variable and XEMA’s is stronger.
1. Temperature
After fillsmallgaps no remaining gaps in the new period were found.
2. Relative humidity
After fillsmallgaps no remaining gaps in the new period were found.

3. Pressure
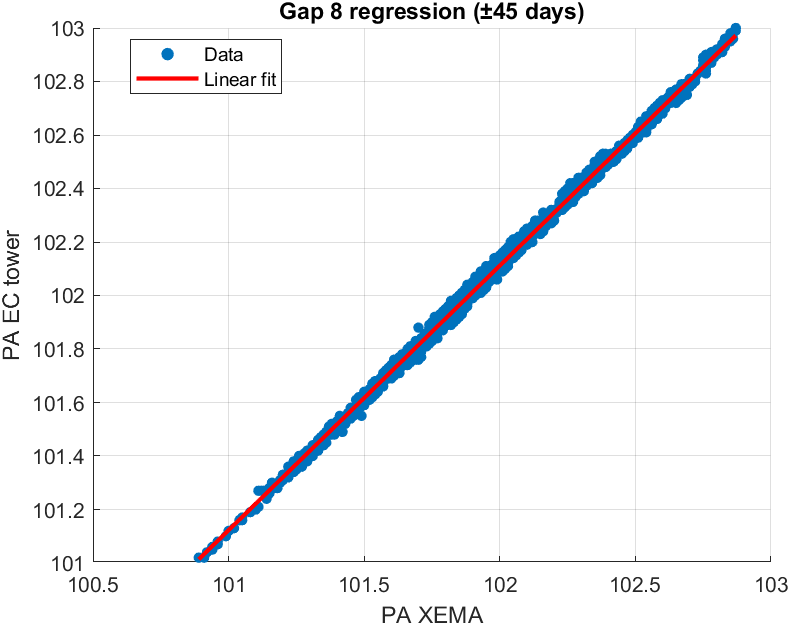
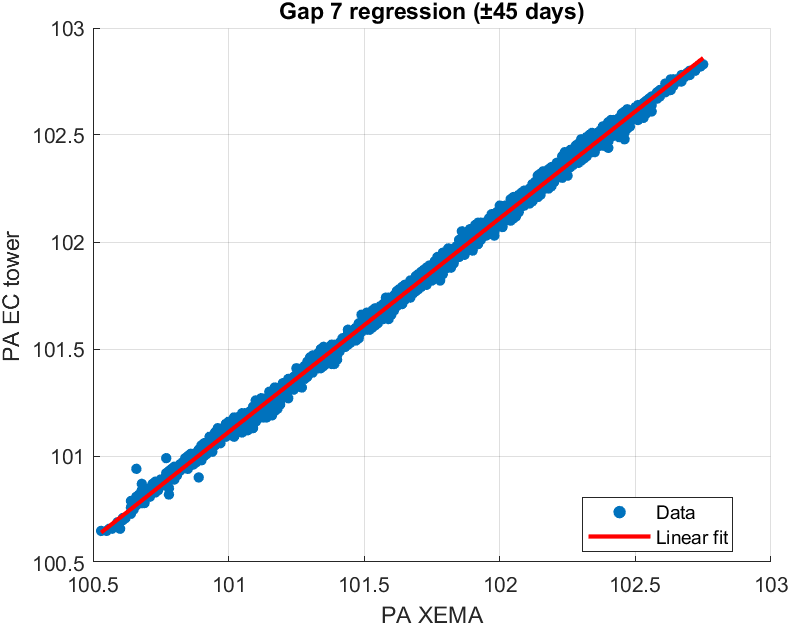
Pressure is taken from the slow ghg flux files, and so there are large gaps corresponding to the periods where there are flux data gaps. In the new period, the following gaps were found:
Gap 7: 30-Oct-2025 10:30 –> 30-Oct-2025 19:30 (19 half-hours)
Gap 8: 01-Jul-2026 00:30 –> 03-Jul-2026 10:30 (117 half-hours)
(Gaps 1-6 correspond to the previous processed period)
There is a very good correlation between our pressures and xema pressures (0.999 for both).

In Riet Vell we don’t have a rain gauge. Data is taken from Alfacada met file, that uses the rain gauge in Alfacada tower + fills with XEMA data.

Gaps due to farmwork: (assigned NaN)
Gap 1: (previous data processing)
2025-04-01, 17.30 UTC we moved the radiometers, SHF plates and TC off the field for farming work. April 30th, 2025, 15.00h UTC Pep repositioned the sensors.
Gap 2:
17/09/25 9h – 02/10/25 13.30h we removed radiometers, shf plates, tc
Gap 3:
30/10/25 9.30-11.30h we removed radiometers, shf plates and tc.
Gap 4:
28/04/26 13h UTC – 07/05/26 13h UTC we removed radiometers and shf plates.
Gap 5:
28/04/26 13h UTC – 21/05/26 11h UTC we removed thermocouples.
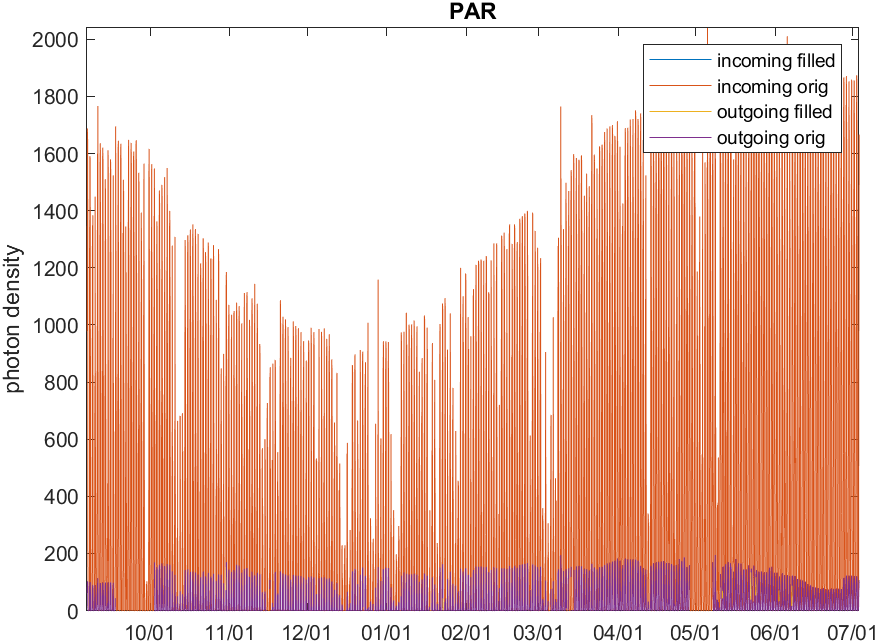
PAR out was set to NaN during farm work periods.
No big gaps were found for PAR in. We could correlate XEMA solar irradiance with PAR_in for big PAR_in gaps.
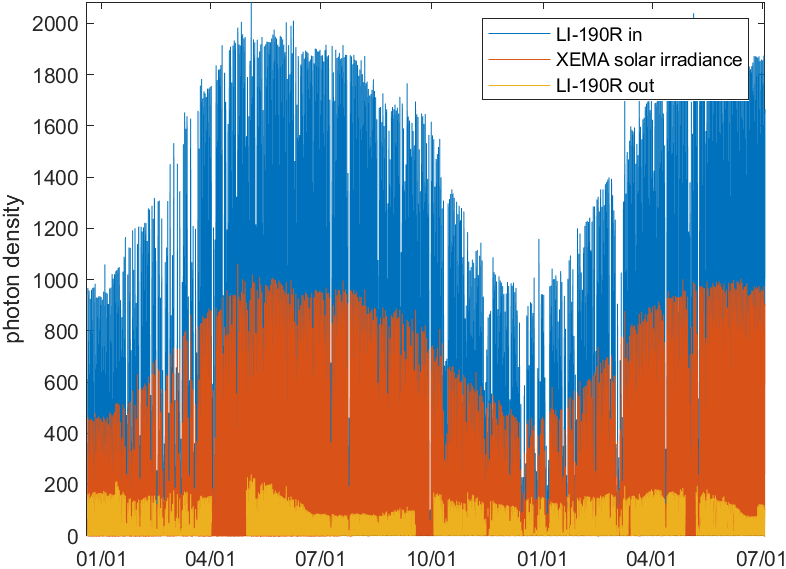
SW_out and LW_out were also set to NaN during the farmwork periods.
No big gaps were found in SW_in nor in LW_in.
The sudden drop in LW out in May 2025 and May 2026 corresponds to the flooding of the field.
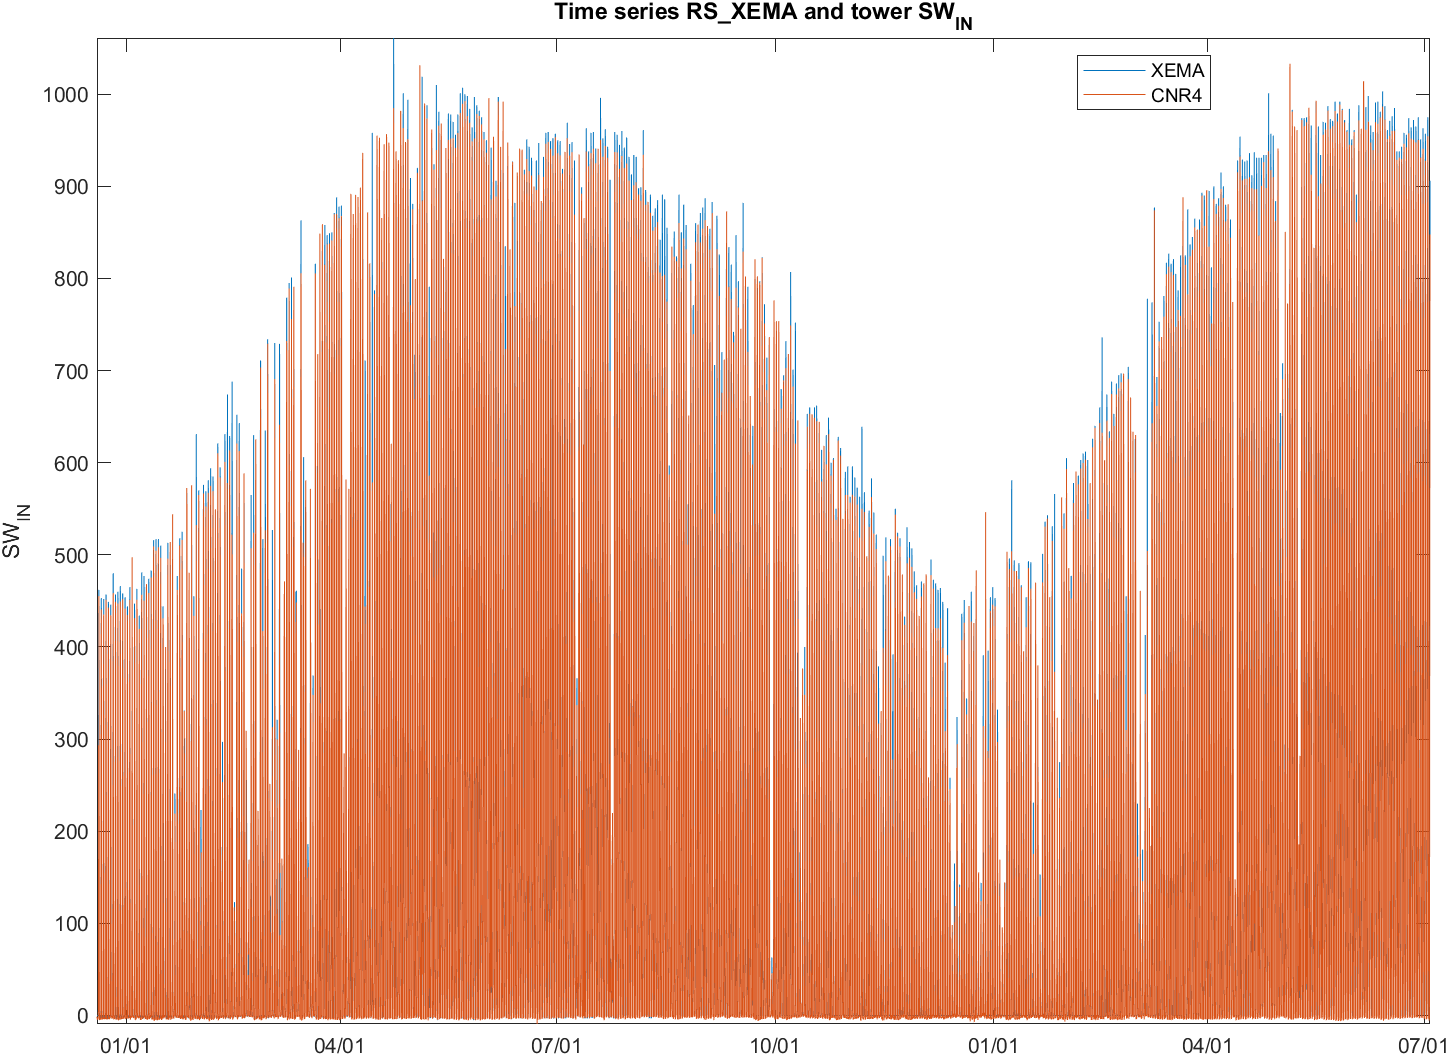


Net radiation also has NaN values during farmwork periods:

Soil heat flux plates are NaN during fieldwork periods.
Exctracted from the fieldnotes:
09-01-2026: We downloaded met data. SHF2 was reading negative values. Angèlica checked it and it was tilted. It was reburied, and now it records higher than the other plates, let’s check next time when the soil is settled.
26-01-2026: We noticed shf_2 (positive values) was again different that shf_1 and shf_3 (negative values). We reburied shf_1 and shf_3. Shf_3 was maybe deeper than 2cm. After a few minutes, shf_1 and 3 were positive and similar between them, but higher than shf_2. We reburied shf_2 again. We will need to keep an eye on it, but the position of them is ok.
07-05-2026: Reburied all SHF plates at a depth of 4 cm
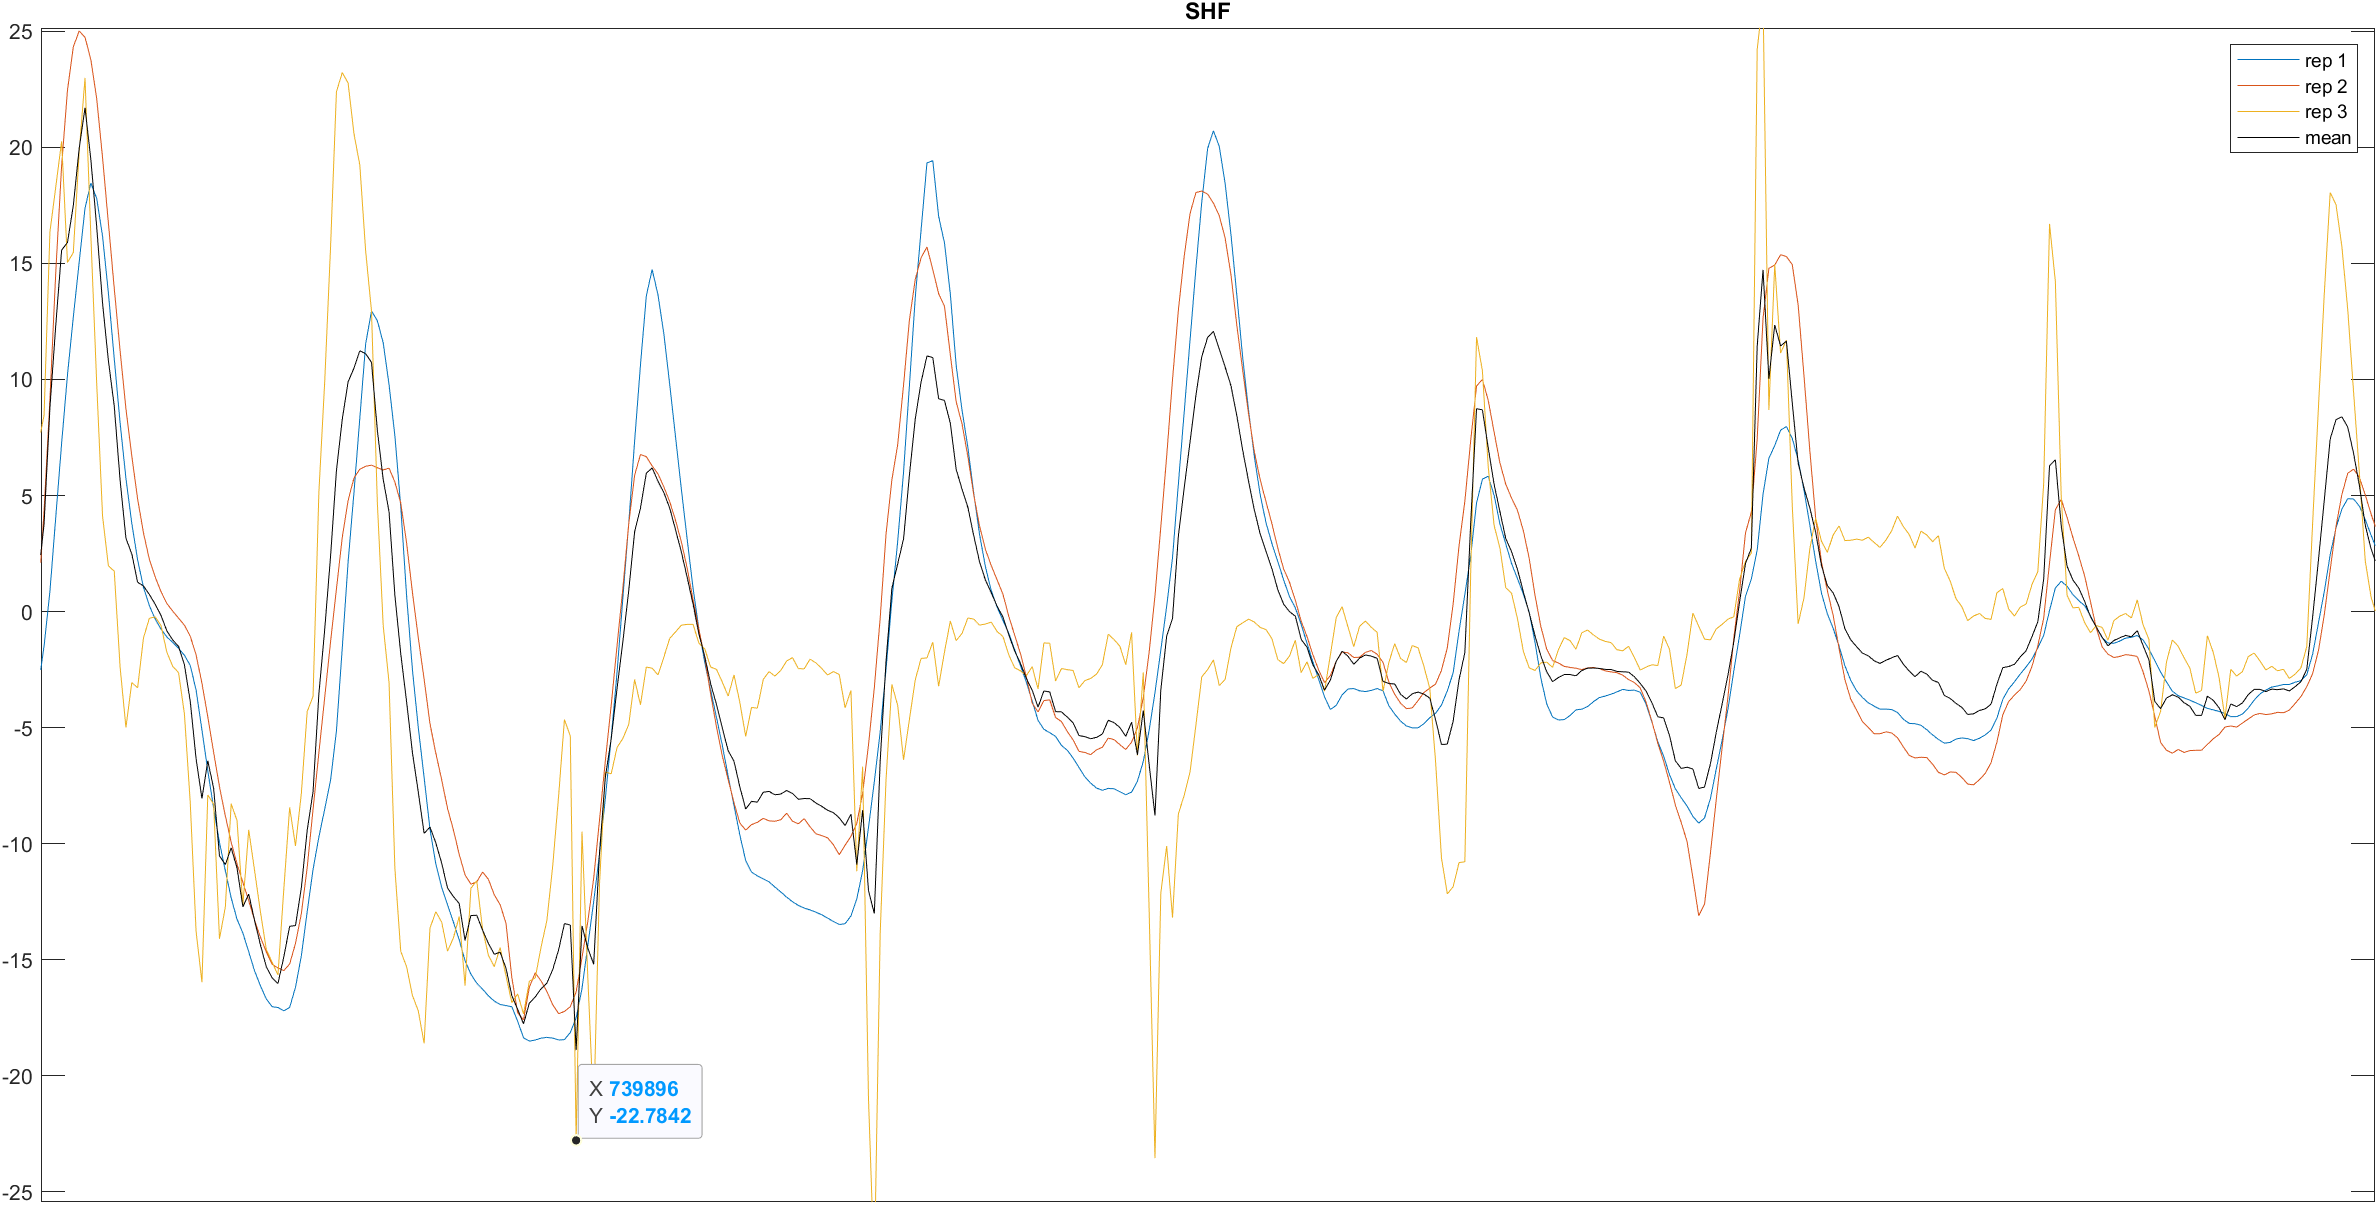
Despite these comments, the three replicas seem to be in high accordance.

We do see the shf 3rd replica following different values than the other ones. We delete shf_3 data from 02-10-2025 13h to 16-10-2025 14h.
16-10-2025: SHF_3 recorded different from others: it was because it was unburied. Angèlica buried it again.
Replica 3 from TS_min2 seems to be way larger than the others. It does not happen in other depths.
It is interesting that the difference between replicas only happens at certain periods.
In the field notes there are the following comments:
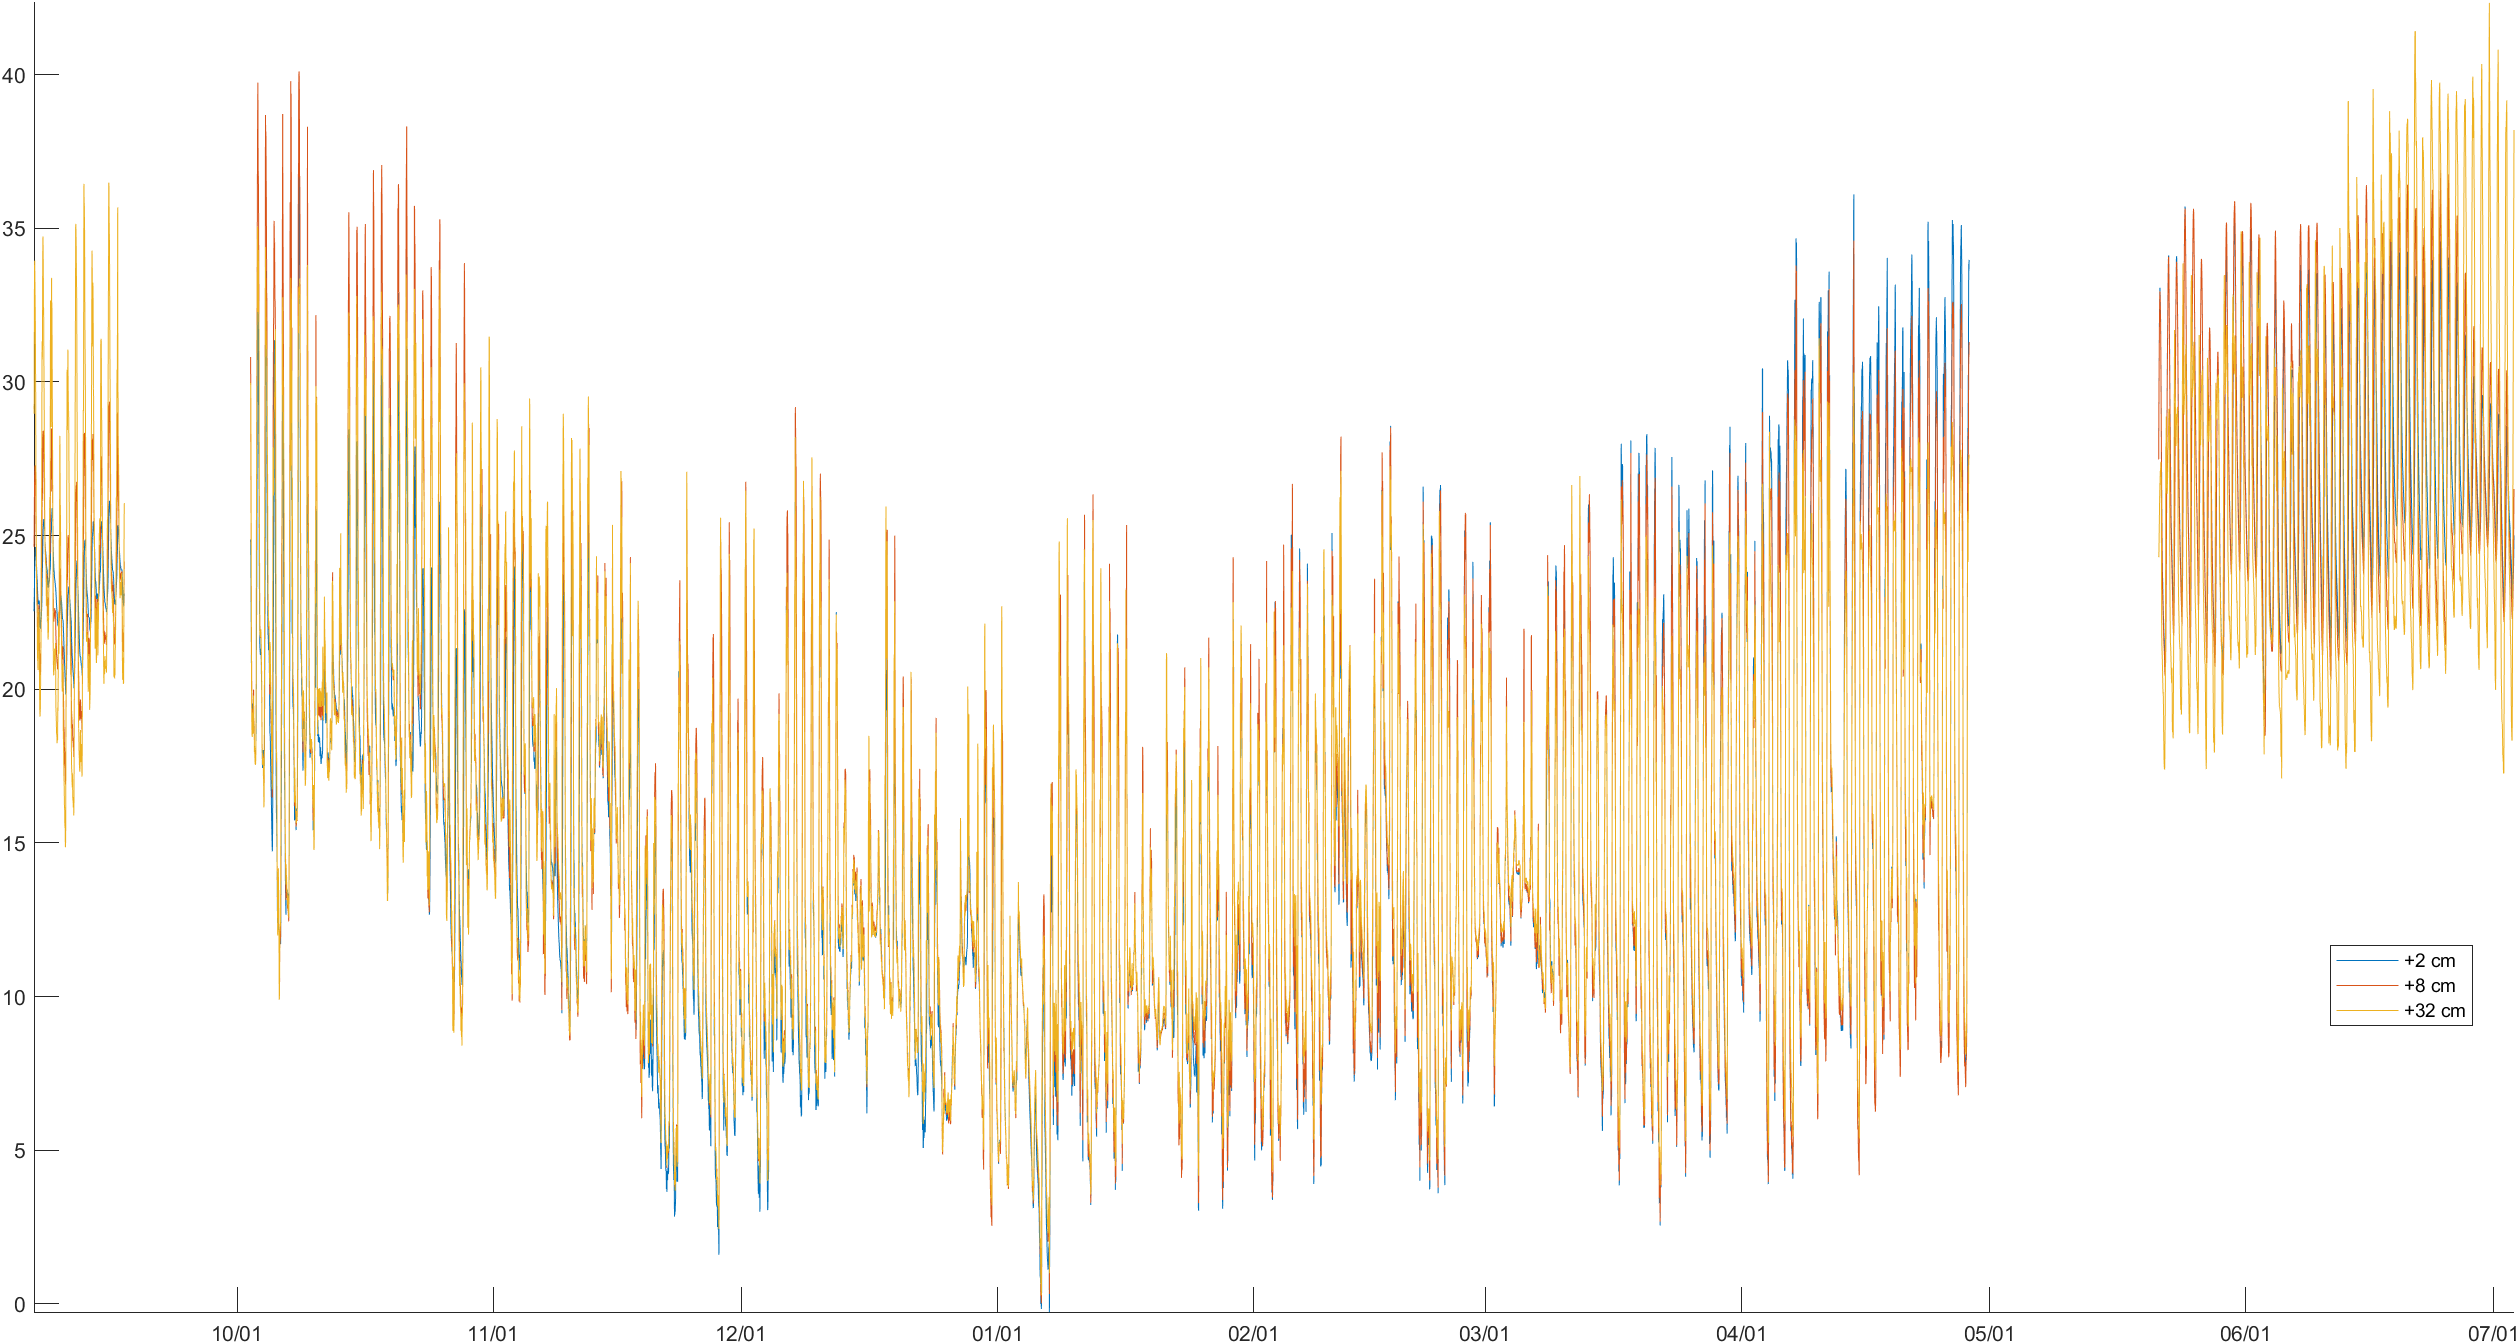
2025-09-04: Metdata looked good except from TC_min2_3, which is too high, 33ºC compared to 24-25 of TC_min_4 and TC_8_3.
2025-09-17: We made tests with the TC_min2_3 that was a bit higher than supposed to and realized that the -2cm in the tc3 was not responding to the stimuli it was given. However, we could not detect which temperature it was switched with, since the other ones seemed fine after also testing them.
2025-10-02: The reading on TC_min2_3 was still too high, so we re-taped it to stabilize the reading. We will need to check it next time.
2025-10-16: TC_min2_3 still read higher than the other ones. We will need to substitute it.
The TC could be damaged and read badly. Another possibility is that the profile is not well positioned and the minus2cm is exposed, or that the 3rd TC is positioned in a place where the temperature is higher.
We decide to remove replica 3 of TC_min2_3 for the periods 9/7/2025-17/9/2025 and 21/05/26-3/7/2026. We will change the tc in the field and check in the future.


In the field notes there is this comment, however, no weird values are shown for replica 2, so we do not delete the data:
2025-10-02: TC_min32_2 had lost its black covering, so we should replace it when we build the third tower, using a thermocouple from the spare equipment.

09-01-2026: TC_8_3 reads NAN the brown wire broke. We cut it and rewired it.
However, I do not see any big gap of this TC during January.
We save individual TC for European submission.
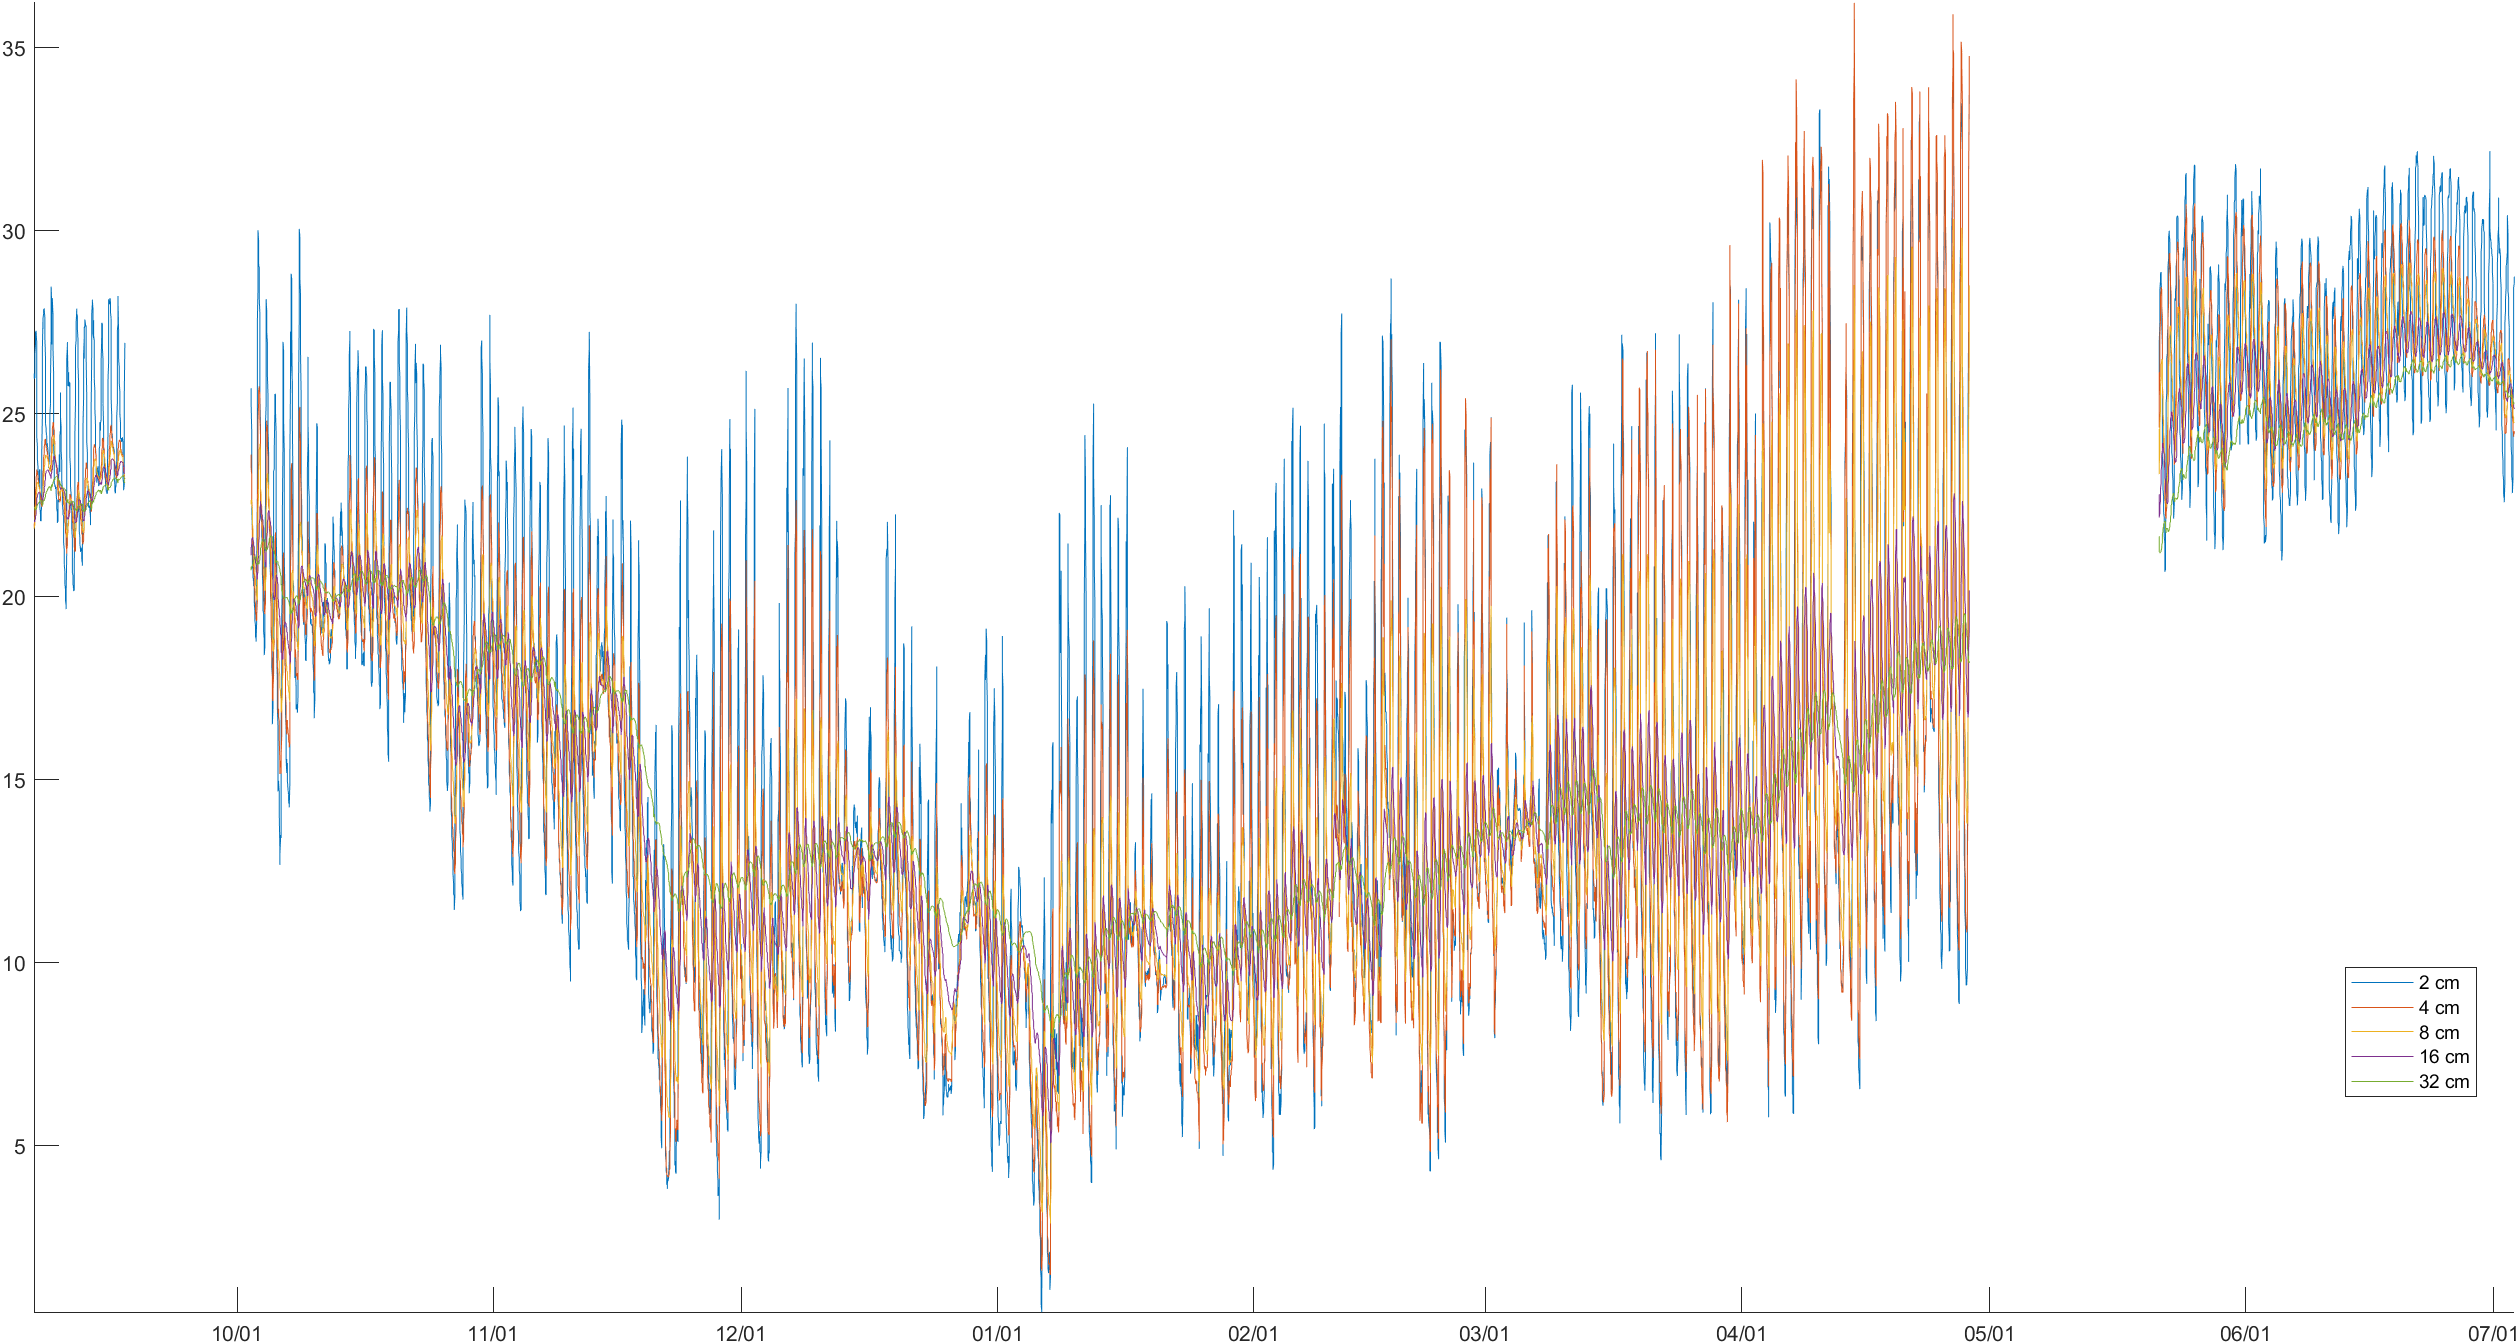
Replicas seem to have similar values between them. We apply gaps for farmwork periods.