Processing Notes
Location: Riet Vell
Author: Angèlica Busquets Rubiés
Date: 2026-07
Processed period: 2026-01-01 (1) to 2026-06-30 (181)
Code: L0, L1, L2
DOYs we went to the field: 9/1/26 (9), 26/1/26 (26) , 19/2/26 (50) , 24/3/26 (83), 7/4/26 (97), 28/4/26 (118), 7/5/26 (127), 21/5/26 (141), 1/6/26 (152), 19/6/26 (170).
Raw to Mat
We first run the Raw to Mat code. Some issues arise in this step:

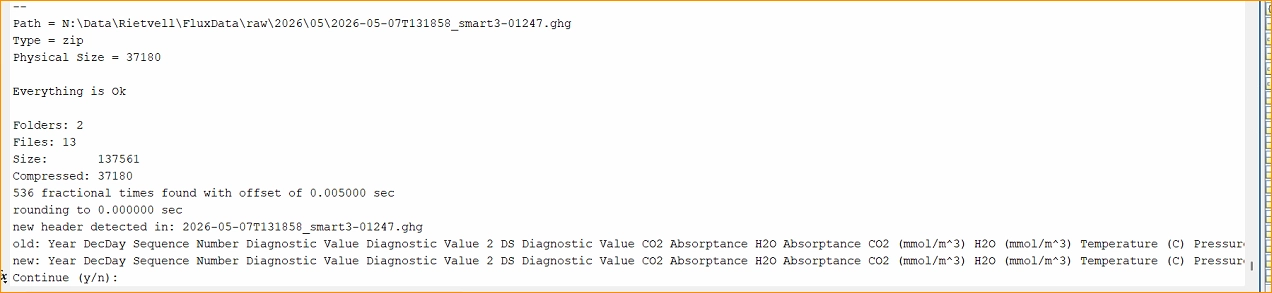
New header did not have these: CH4 Seconds CH4 Nanoseconds CH4 (umol/mol) CH4 (mmol/m^3) CH4 Temperature CH4 Pressure CH4 Signal Strength CH4 Diagnostic Value CH4 Drop Rate (%) CHK.
The corrupted files, with strange datetime stamps, were:

Those hours we were in the field. These are the notes from that day regarding flux data, probably the reboot and change of configuration affected the files:
Flux data was downloaded without issues, and all data up to the present date were available. However, the SmartFlux dashboard displayed a warning sign related to a clock synchronization issue with the LI-7700. I checked the clocks, and they appeared to be perfectly synchronized, but the warning persisted.
I disconnected and reconnected the LI-7700 through the SmartFlux software (without touching any physical wiring) and rebooted the SmartFlux system 3–4 times, but the warning remained. I then rebooted the LI-7700 itself, although the warning still did not clear.
Finally, I manually adjusted the SmartFlux clock by setting it a few seconds ahead and waited for the LI-7700 clock to match before accepting the change in SmartFlux. This resolved the issue and the warning disappeared. The LI-7700 PTP setting is configured to automatic and follows the SmartFlux time, which is in turn driven by GPS time. This issue has occurred previously, and we believe it is likely a software glitch within SmartFlux. I left the SmartFlux system logging without warning signs and with the system status reading “OK”; hopefully it remains stable.
Only one hour and a half were corrupted, so I saved these files but skipped them. They will count as gaps.
Level L0
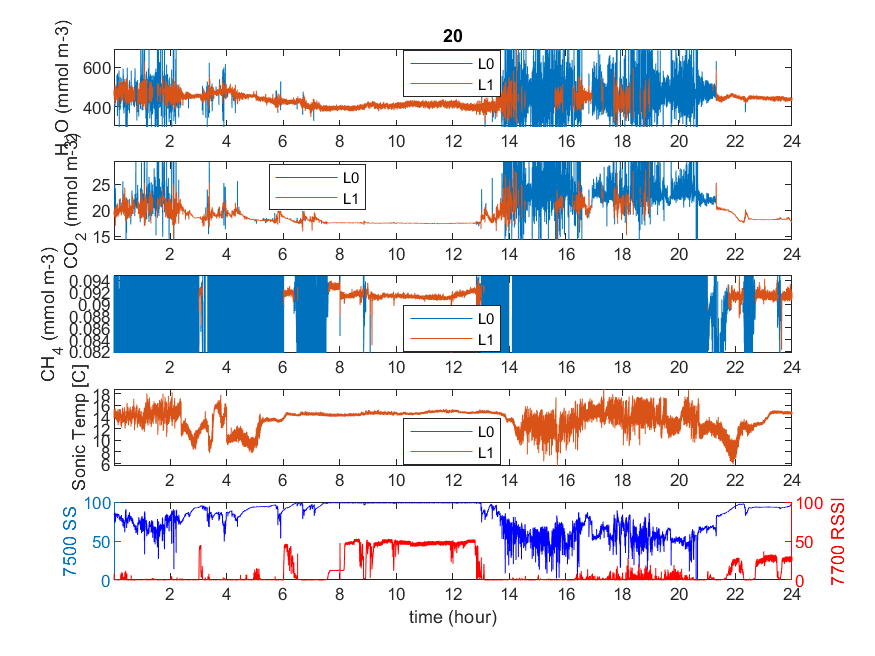
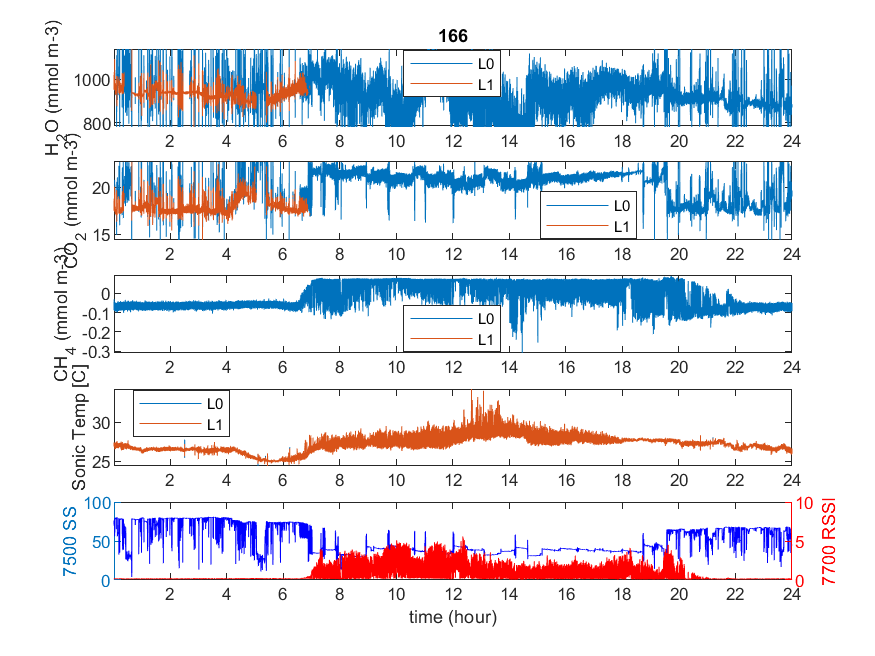
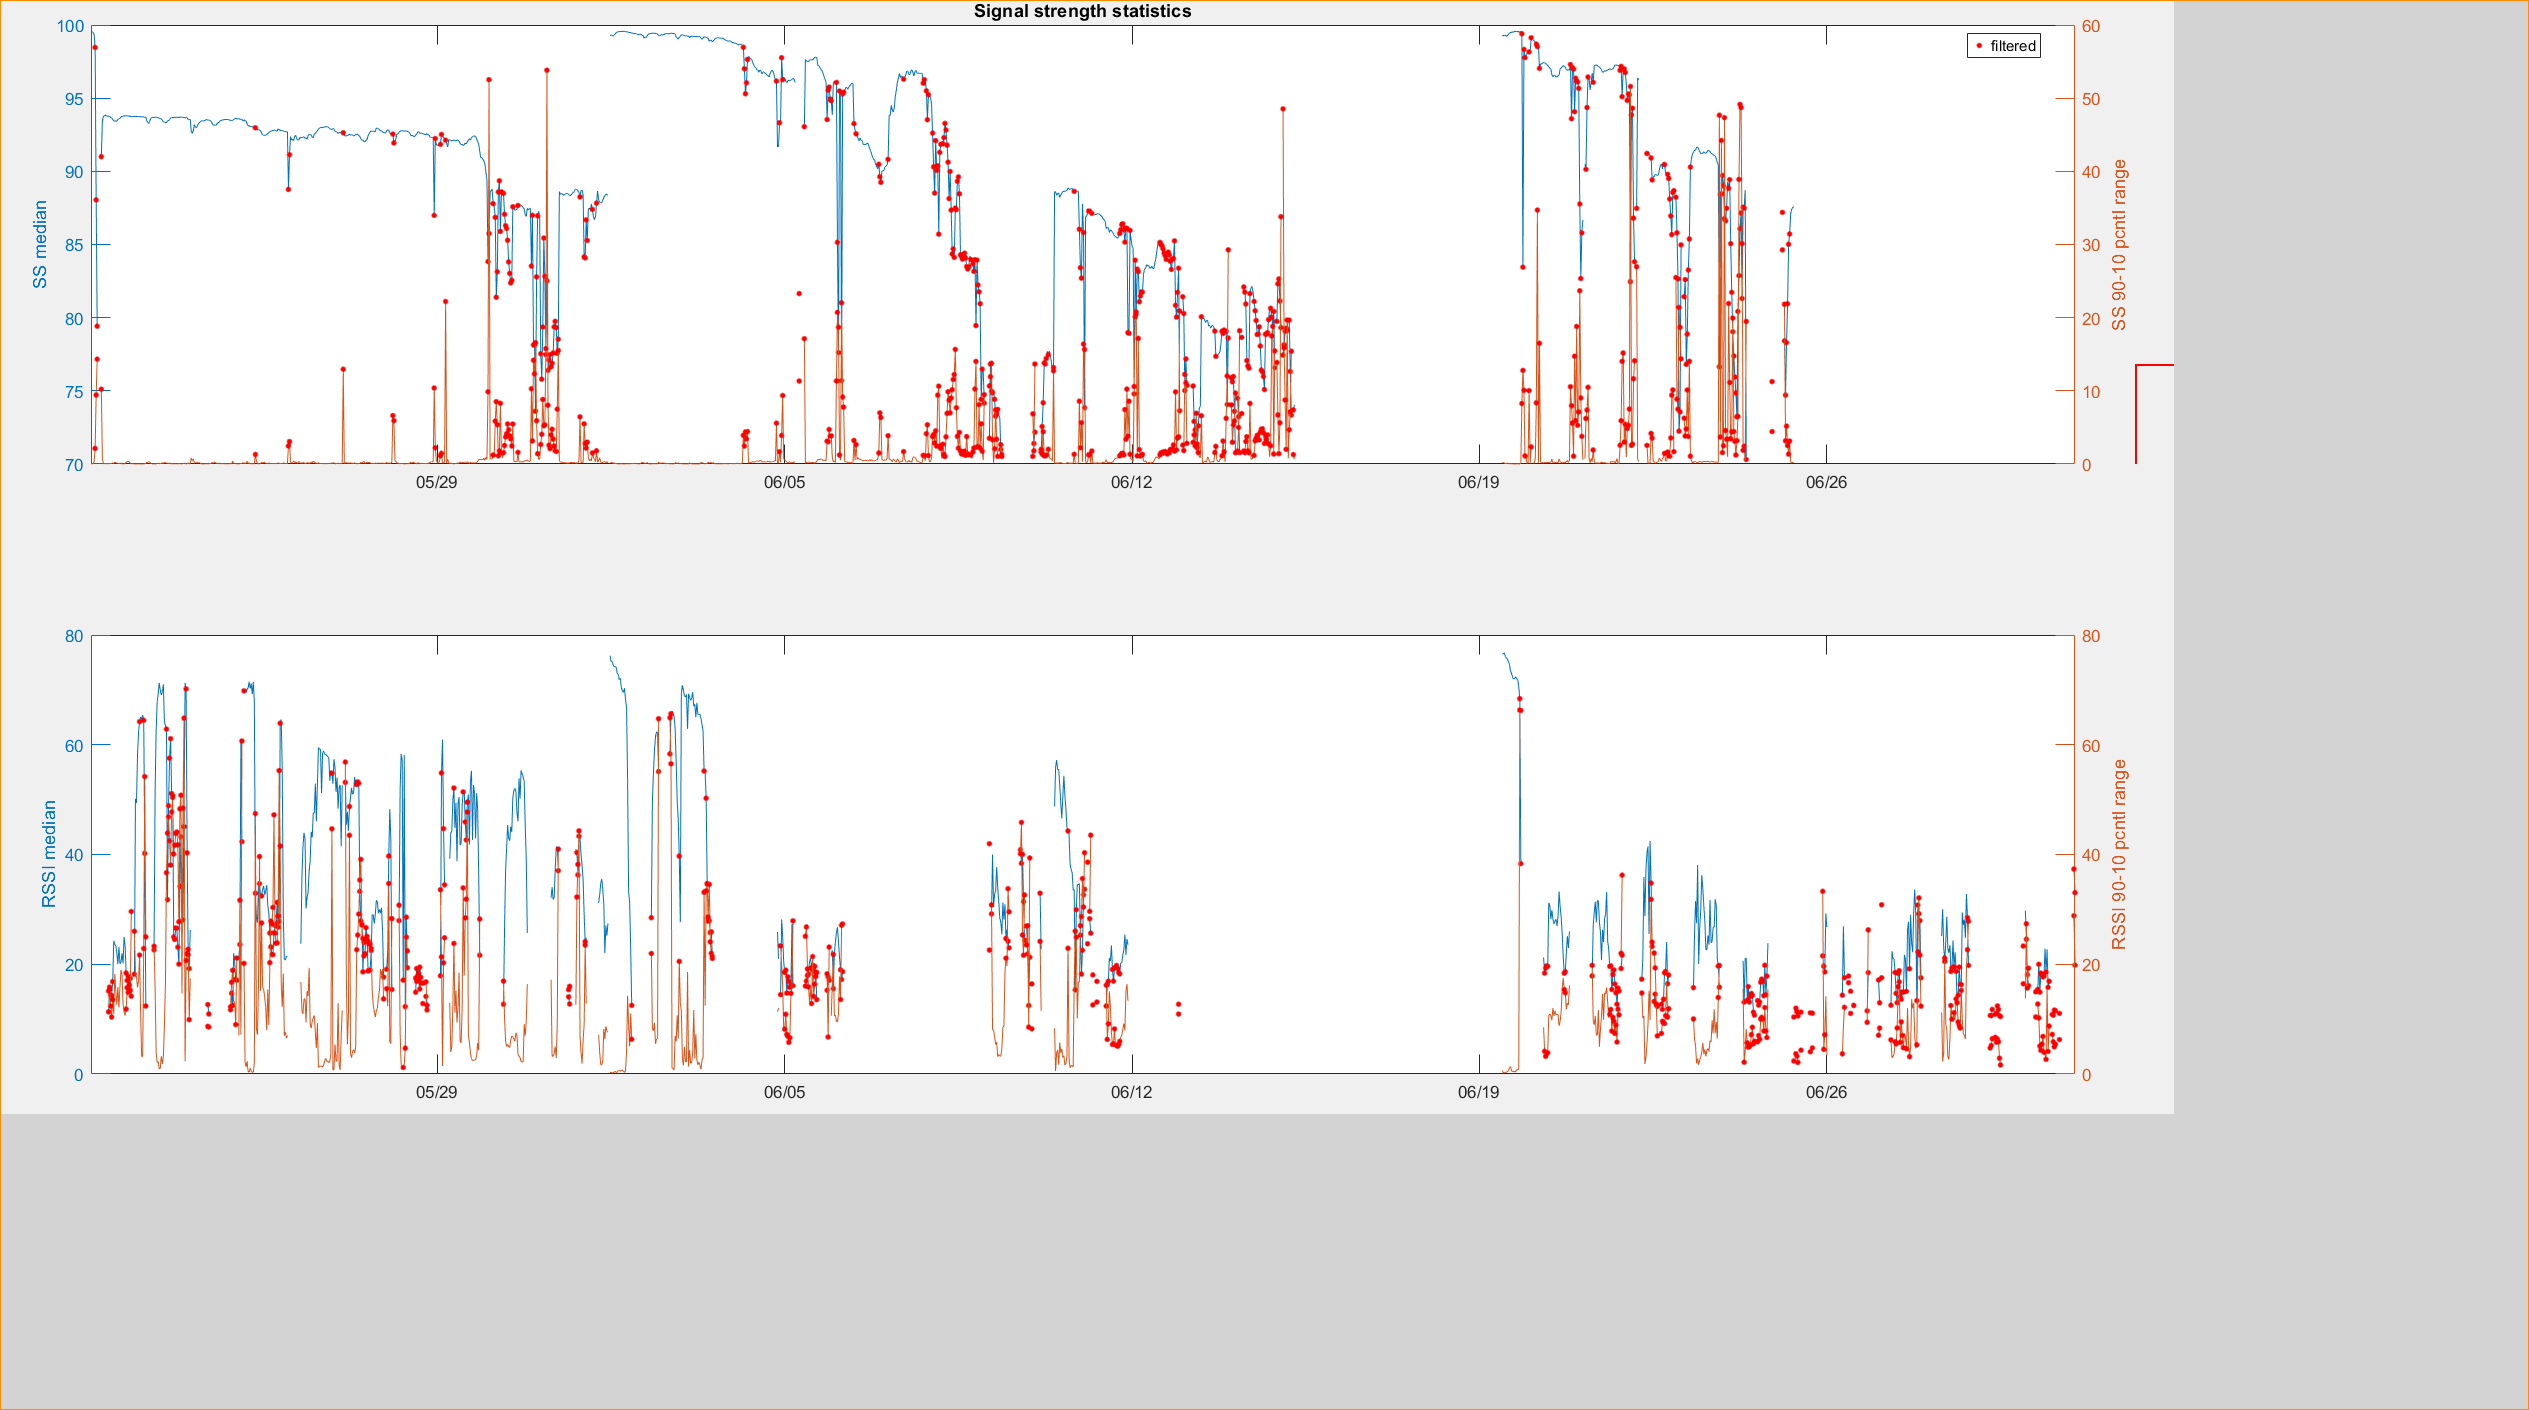
There are many periods with very low SS and RSSI, which filters out CH4 concentrations. Some examples: 64, 65, 124-127, 155, 158, 159, 165-170 (including co2).
Some of these days can be explained with rain. For example:



Some others do not, and it is very likely to be because of the spiderwebs:


There are also a couple of days where RSSI is 0 and CH4 concentrations are directly NaN (-9999).

During some days, RSSI is highly variable. It also happens during winter, so spiderwebs are not the only reason behind this. It could be a clock synchronization issue, but the only time we saw the warning on 2026 was in doy 127, not before nor after.


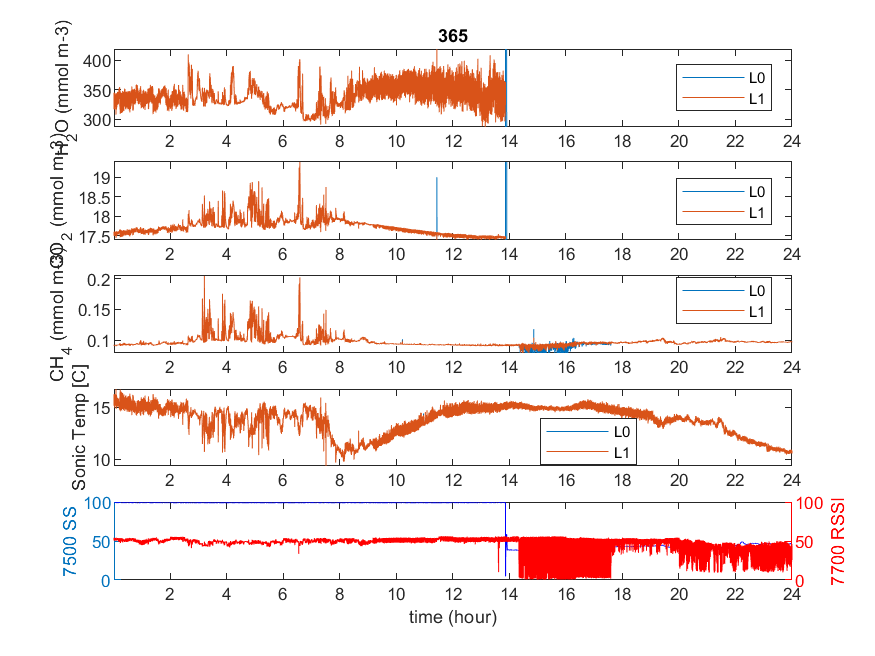
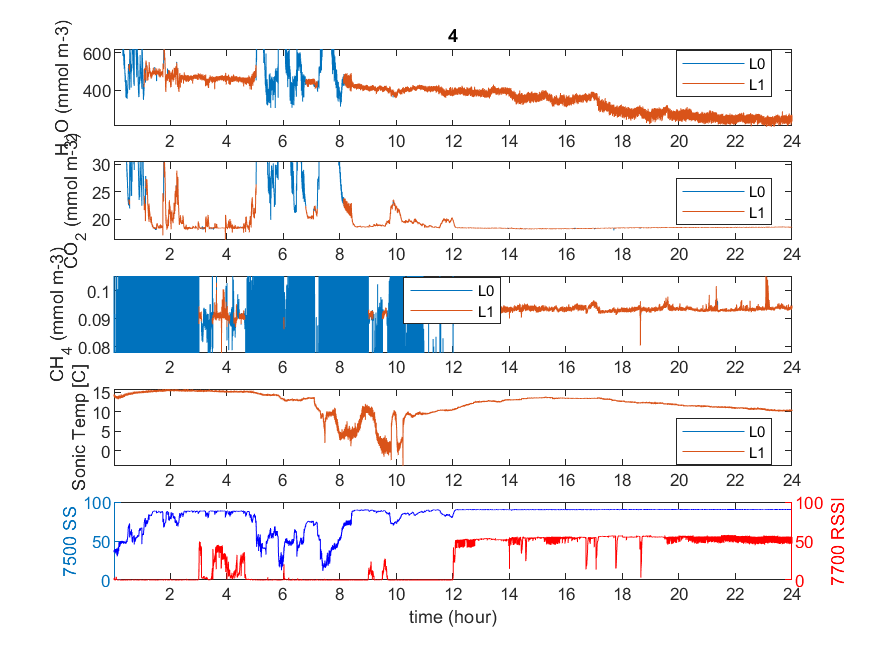
As we already saw in last processed period (september-december 2025), in DOY 365 2026, CO2 SS lowers suddenly, and until DOY 4 2026 there is no CO2 data. In this case, the 4th of January we did not go to the field, so we are unsure of the reason behind SS behavior (maybe rain from night 3-4 cleaned the lens).
During DOYs 176-181 there was a nest in the LI7500 lens, so there is no CO2 data in that period. We cleaned it later in doy 184.


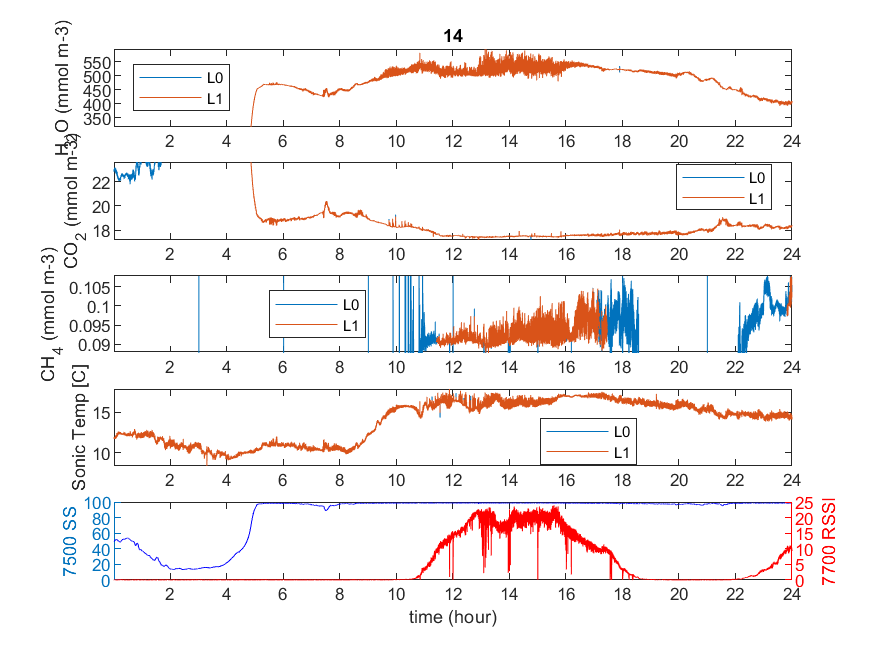
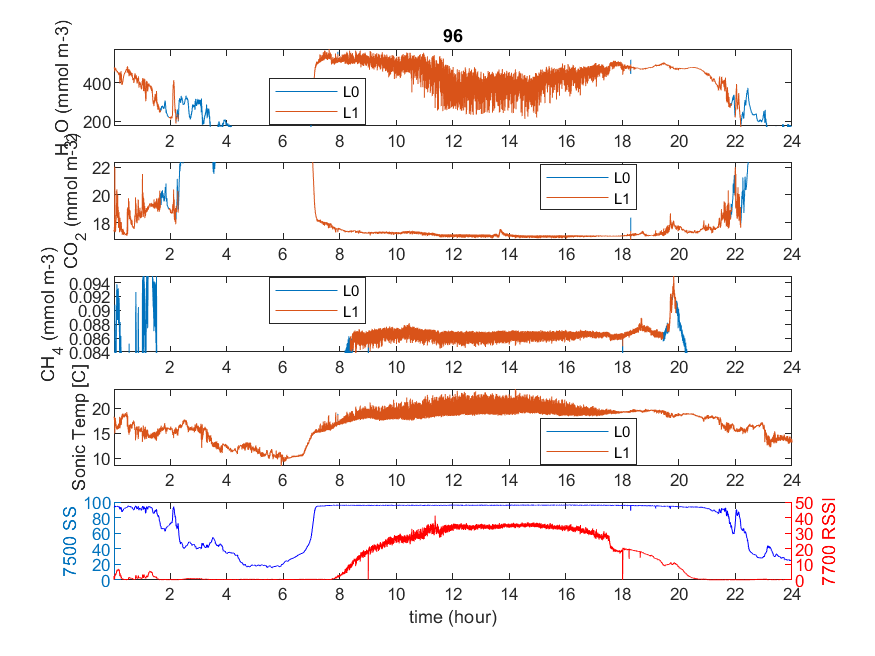
Often RSSI is very low during the night, and around 8h-10h it suddenly rises. We hypothesize that it may be either condensation (we could turn on the heater, but it is weird that it also happens during summer), or an animal that during the night it sleeps in the lenses. There are many nights without data (around 40-50% of the days). It also happens to CO2 SS sometimes, although way less often.
The morning increase of rssi seems to happen earlier when it’s warmer season.
Examples:



On some occasions there is a 30-min pattern in RSSI. It doesn’t seem to be from the auto-cleaning system. Could it be related to the 30min saving files?


There is also a 3-hour pattern in CH4 concentration that might be related to the cleaning ch4.


Important fieldnotes comments:
50: We noticed that the lens of the LI-7700 had some scratches. We cleaned the lenses but only managed to reach to a signal strength of 76%, which may be due to the scratches.
83: Higher than 76%, no scratches anymore
127: spiders are starting to accumulate around the instruments, although nothing outrageous.
141: The field is already flooded. We cleaned the sensors. There are already spiders at the tower.
Level 1 and 2:
We run the code in two different periods, since vegetation height varies over the months.
Reported vegetation heights:
Periods:
Period 1 (1-141)

For aerodynamic canopy height, we see it is not 0, although we know there was almost no vegetation.

At the beginning of the year the soil is muddy and at mid-February it starts to be very dry, but it gets wet again with rain from the 7th until the 15th of March. Then, it gets very dry, so LE starts to decrease and H to increase. The 9th of April the farmers ploughed the field. 14th of May the field was flooded, and we can see the sudden increase in LE. The firsts months have some patterns that look a bit weird (max le and min h coinciding), similarly as it happened last year.
CO2 fluxes do not show clear patterns since almost no vegetation had grown at the field yet. CH4 fluxes reveal higher emissions during January and beginning of February.

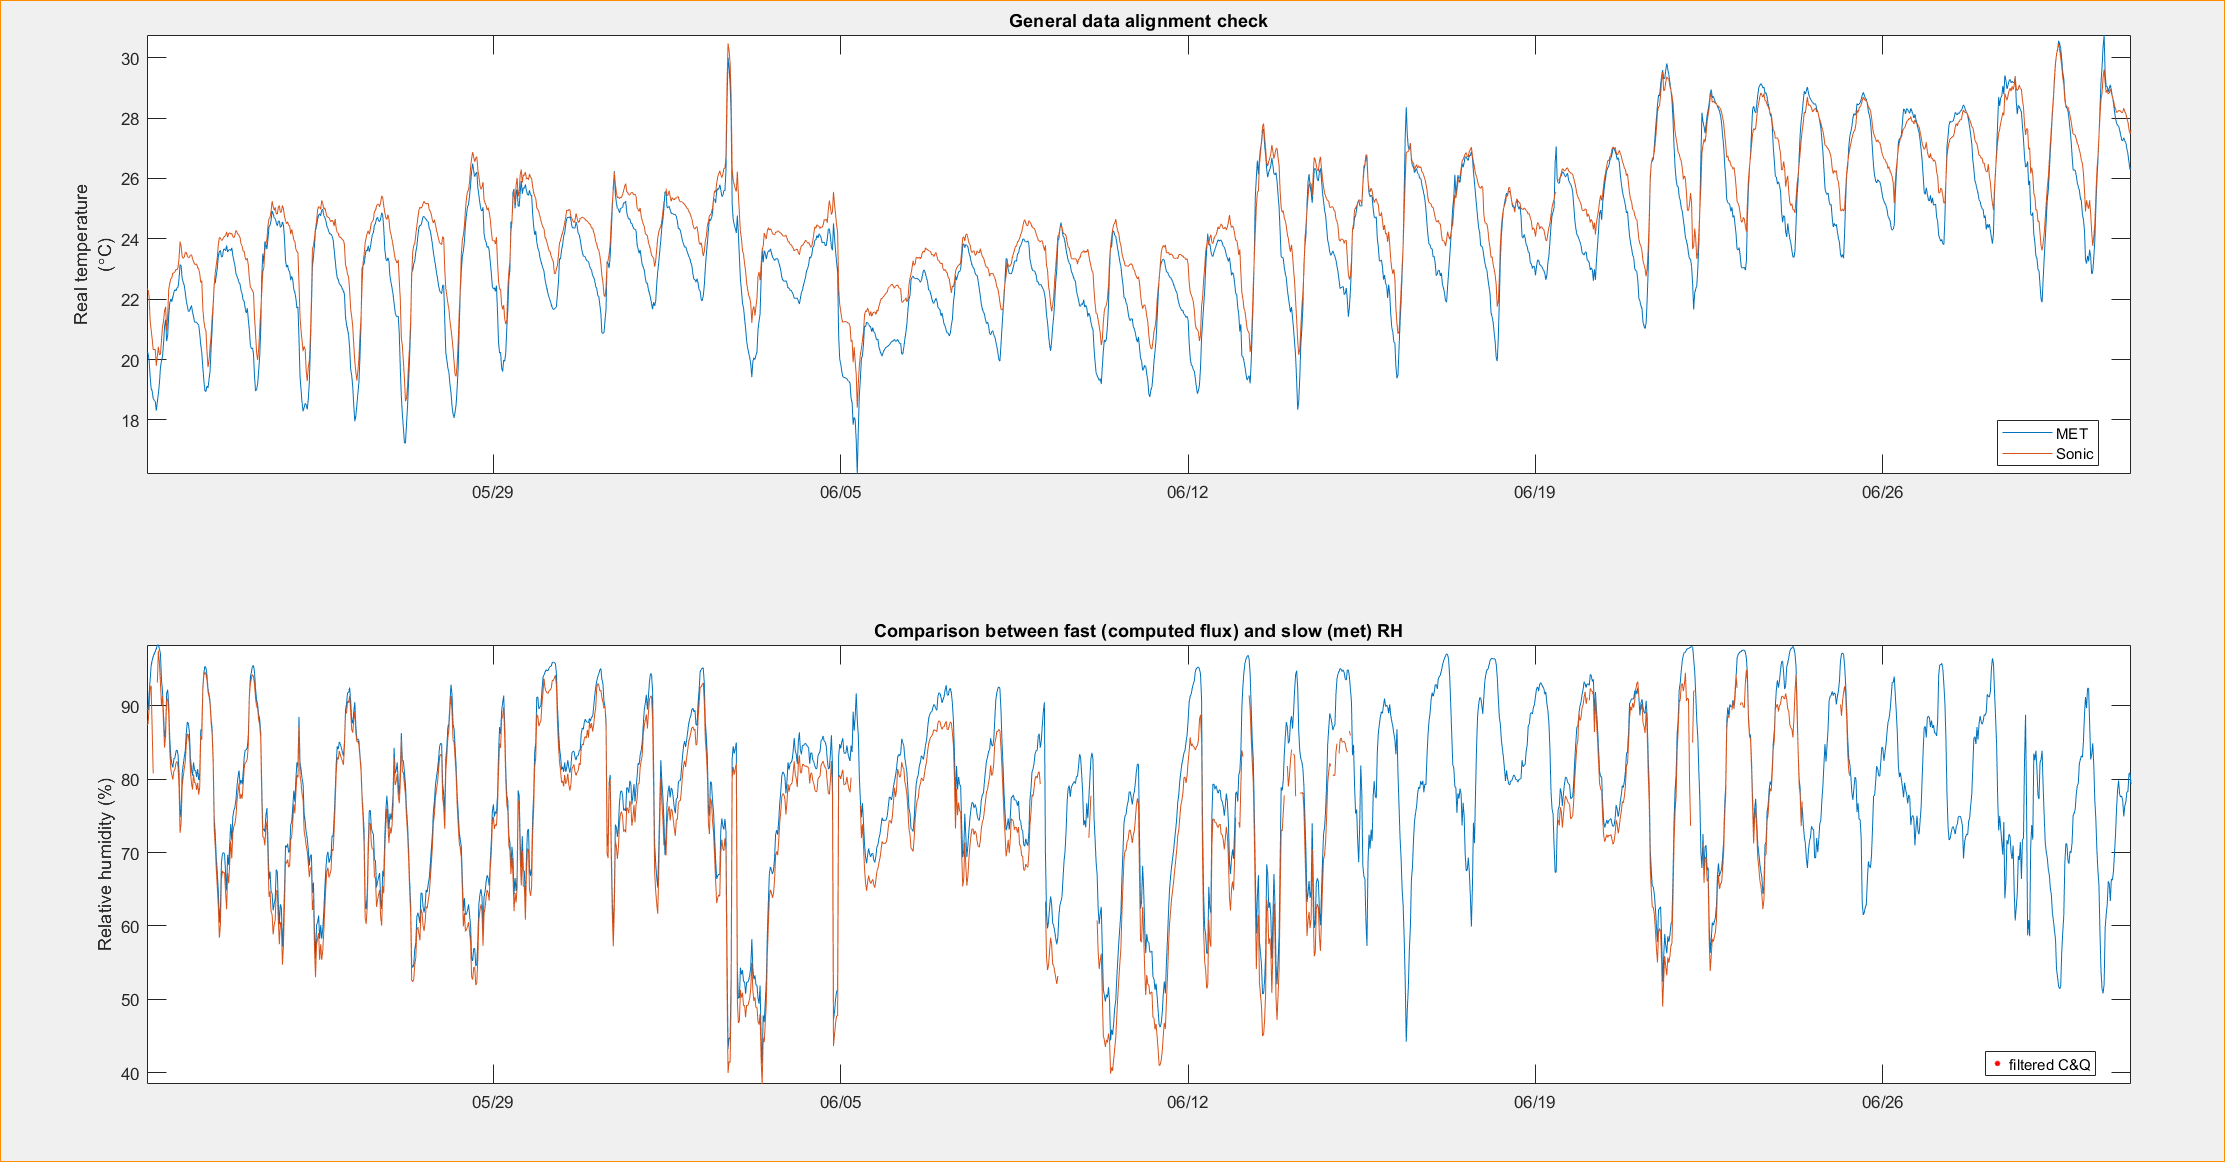
Similarly as past moths, met reaches lower temperatures and sonic higher ones, but peaks are the same. For relative humidity, met reached higher values than flux ones.



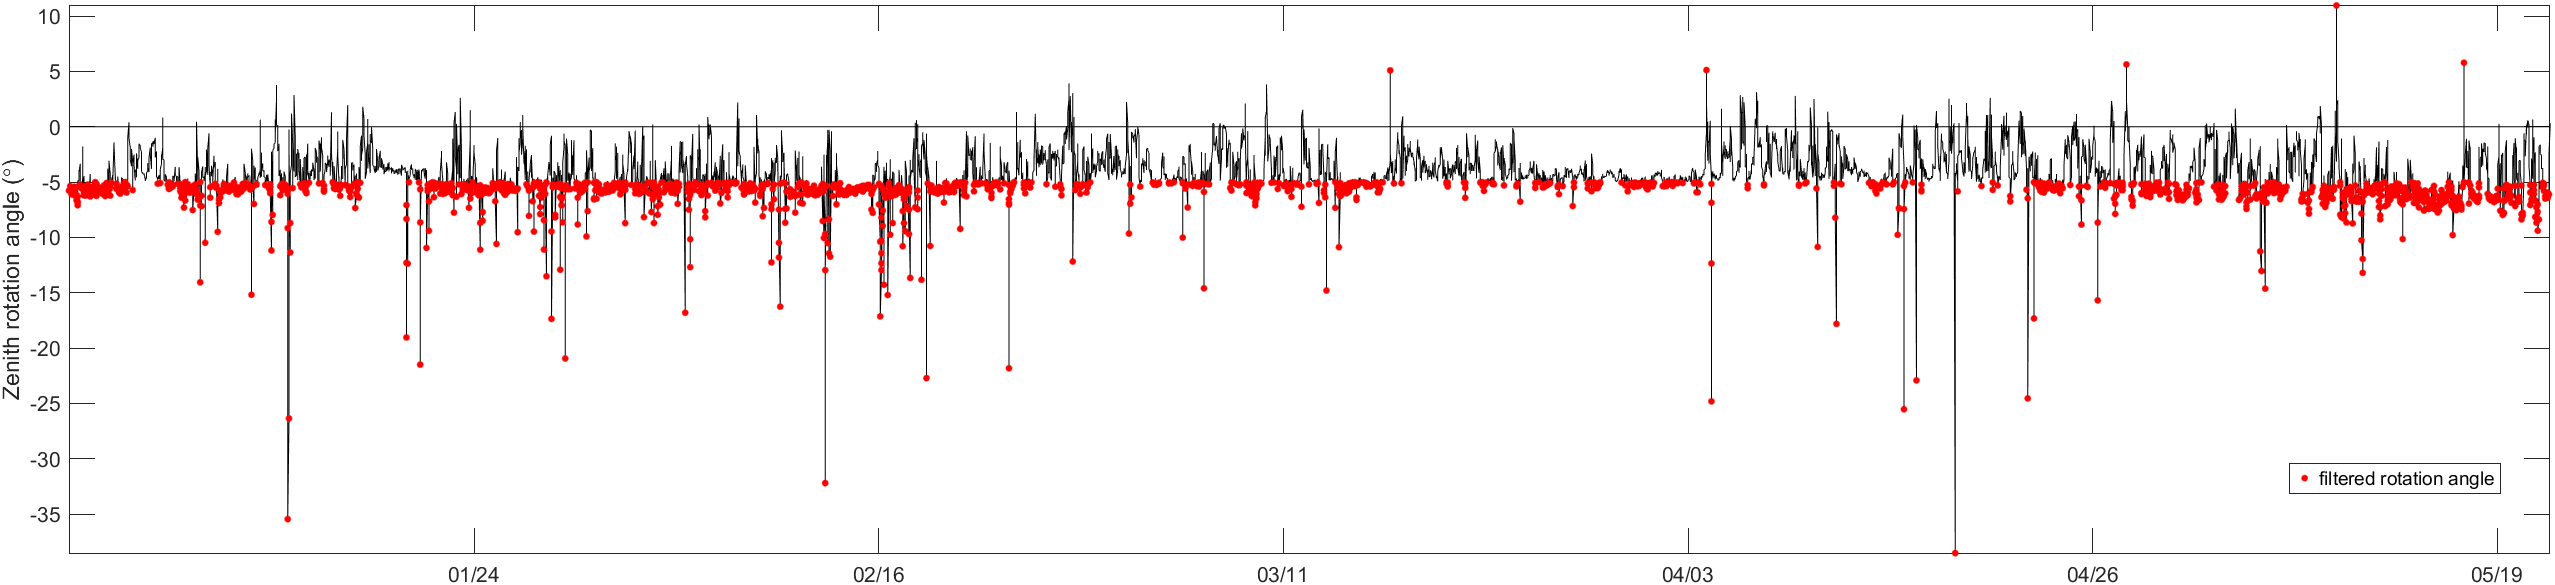
There is many filtered values regarding the rotation angle of the anemometer, increasing with time compared to previous months. We should adjust the sensor, so it is straighter.
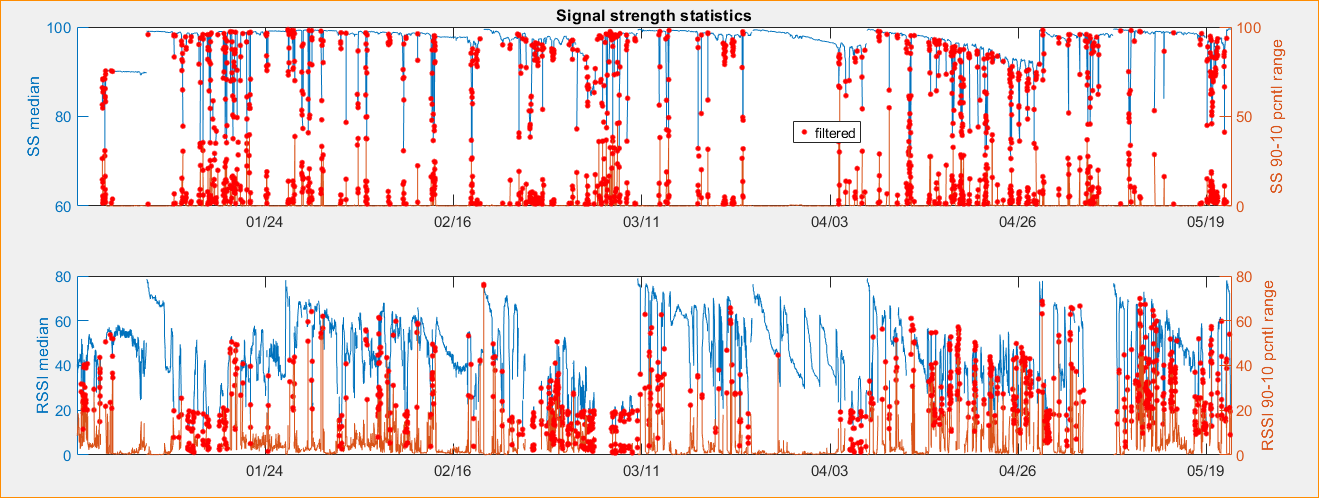
There is a lot of variability in SS and RSSI, even during this time of the year when there is no spiderwebs and the lenses are cleaner.
We do not apply any ustar filter.

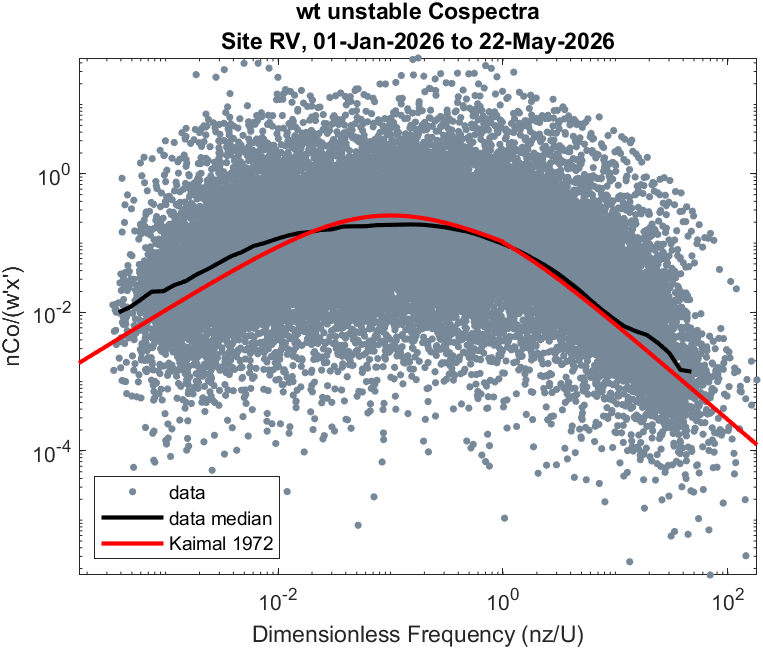
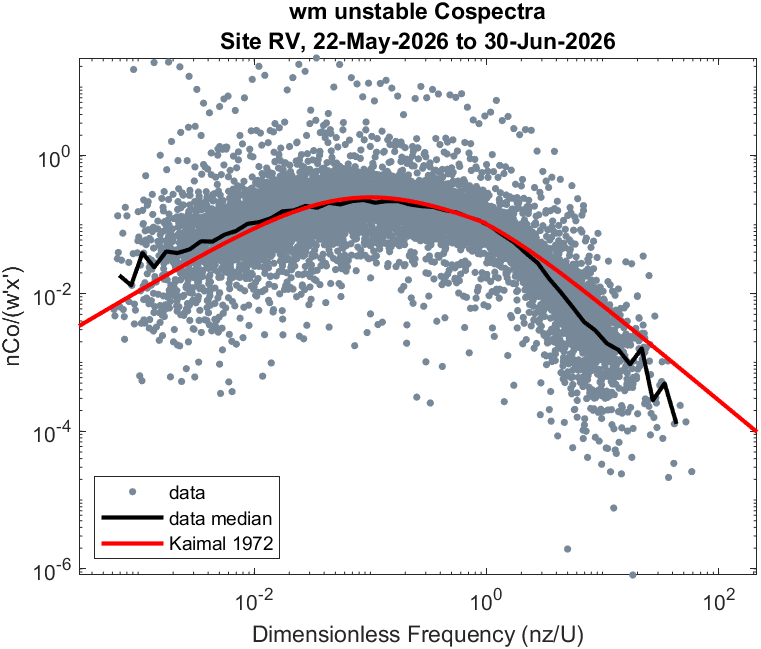
Cospectra: lower frequencies seem to be overestimated, and higher frequencies underestimated (except for wt).


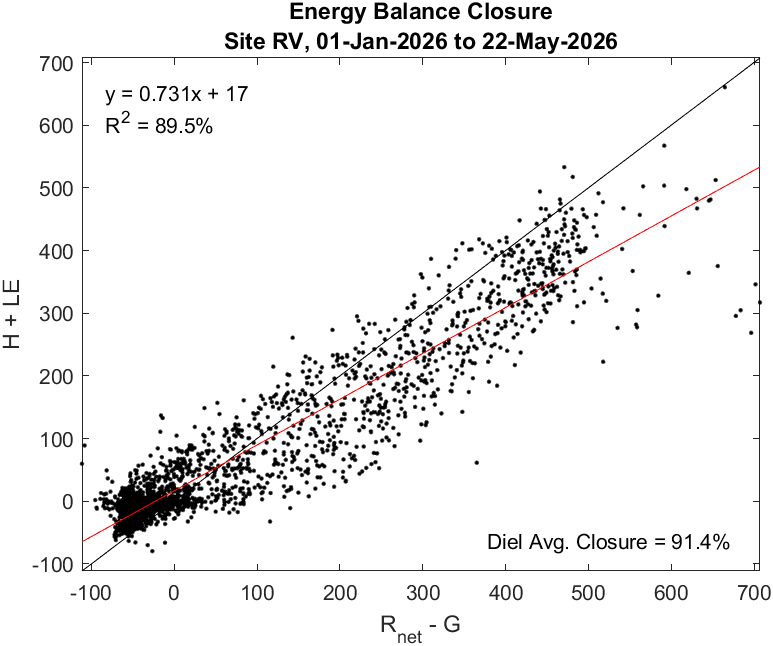
The EBC is quite close to one (more than 70%).
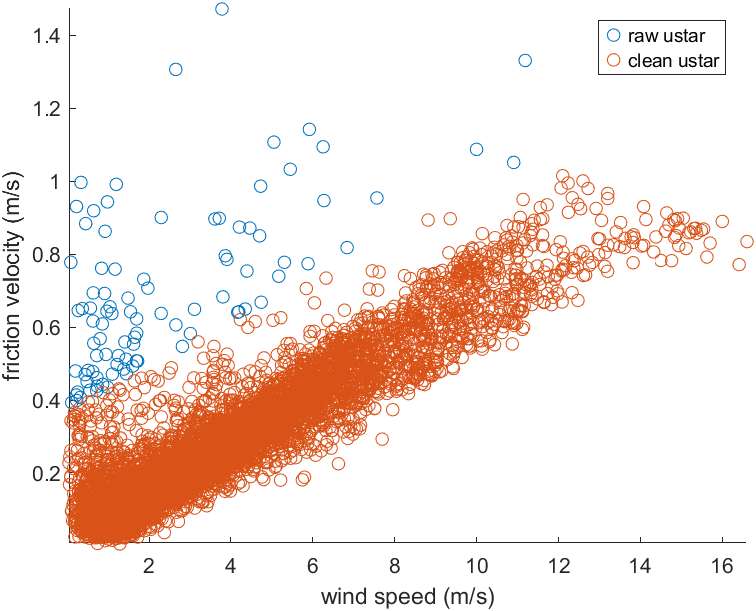
It seems like there is two linear regressions between friction velocity and wind speed.
Period 2 (142-181)
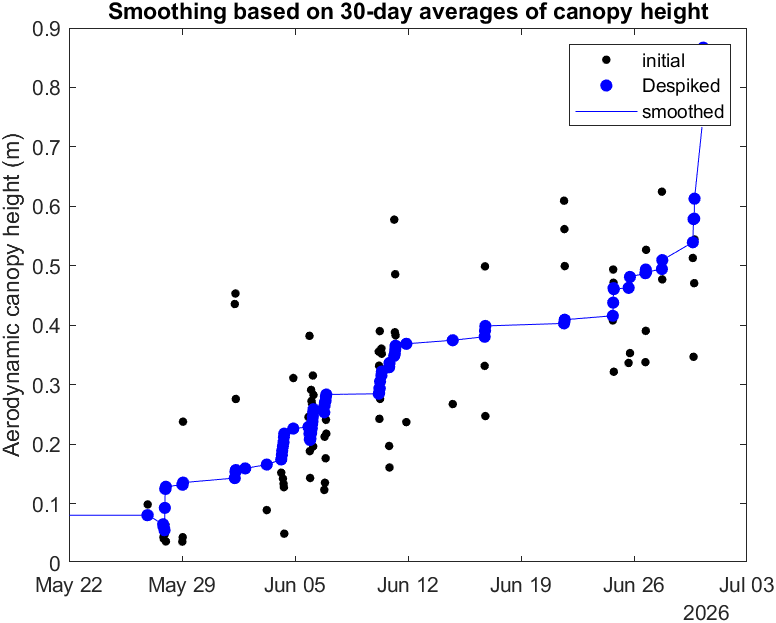

Aerodynamic canopy height shows the growth of vegetation.
We do not apply any ustar filter.

Unfortunately, there are a lot of gaps in this period because of the spider nests and spiderwebs being in the sensor lenses and paths.

We can see that LE dominates over H since the field is flooded.
We can also observe an increase in CO2 negative fluxes due to vegetation growth.
Met and sonic temperature and RH are very similar between each other.
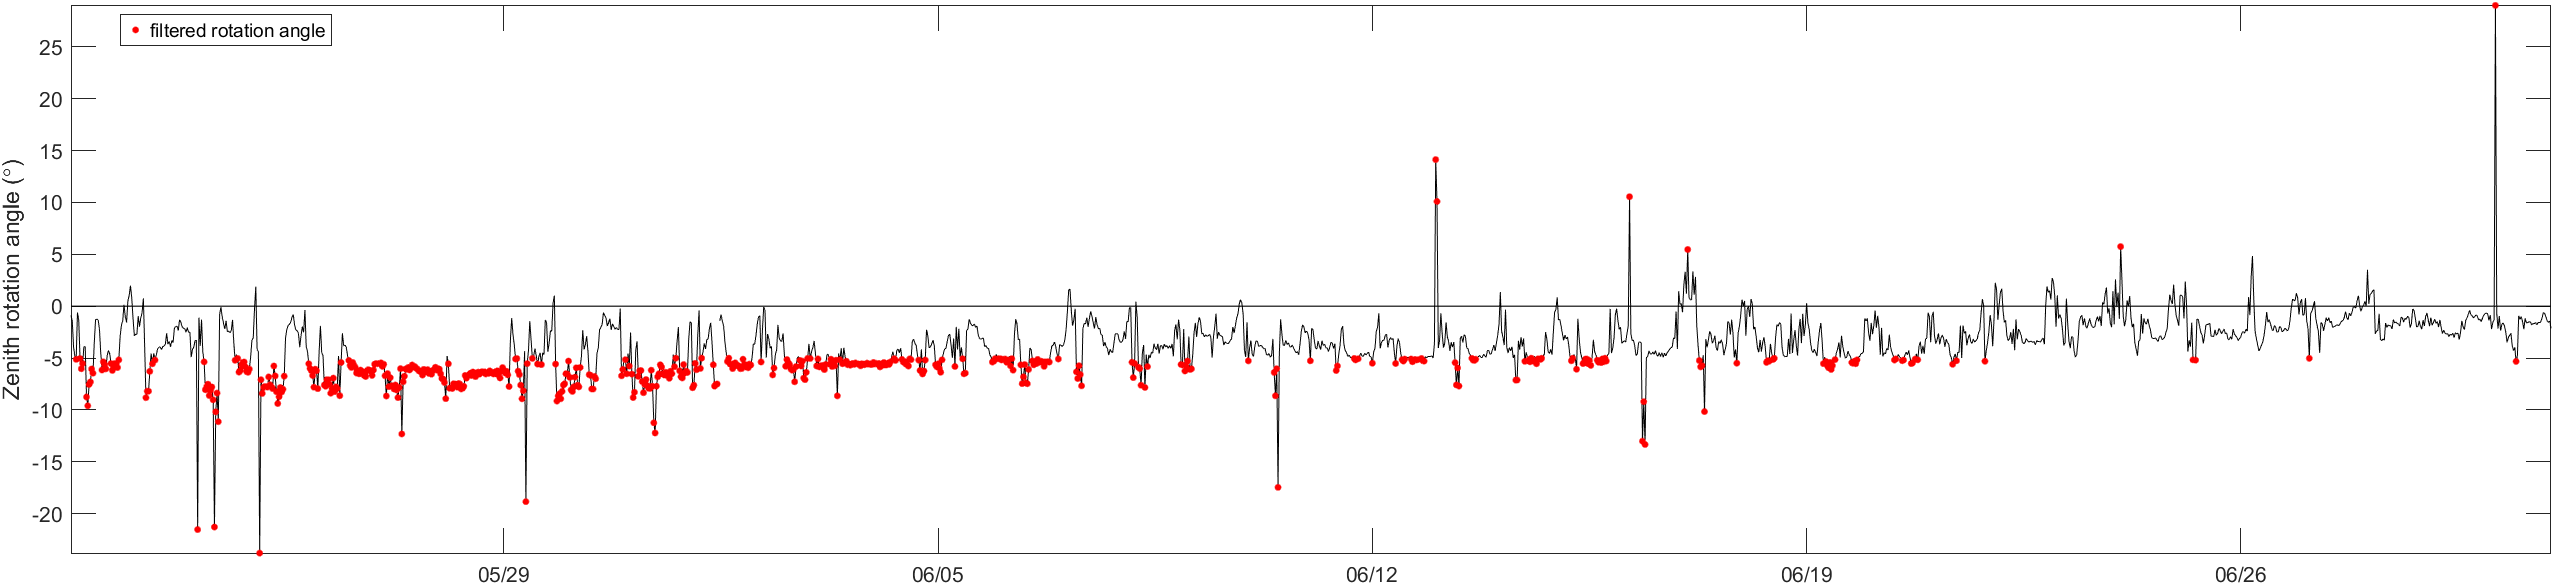
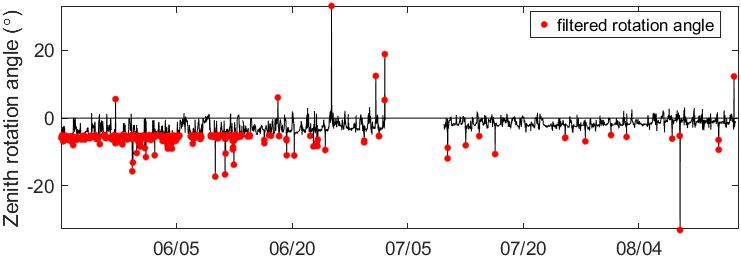
Without any apparent reason, the zenith rotation angle gets closer to 0 in the last days.
This also happened in 2025:
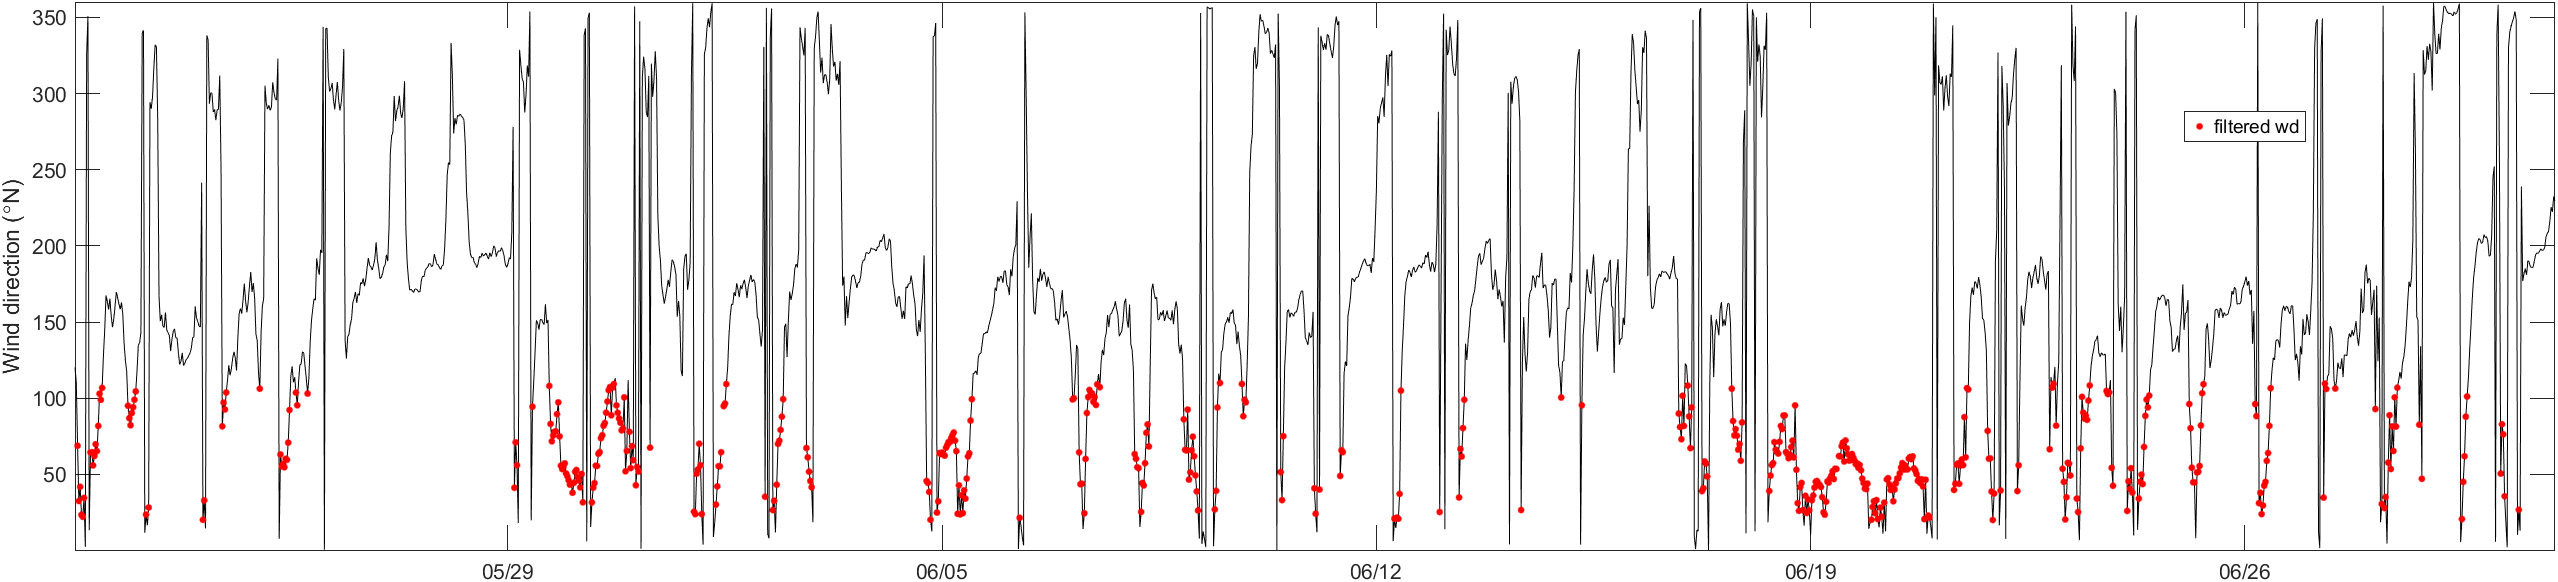
It could be due to a seasonal change in the wind direction, but it does not look like it from the WD plot:
The wind speed does look a bit lower the last period. A higher wind speed could make the sensor tremble and tilt:


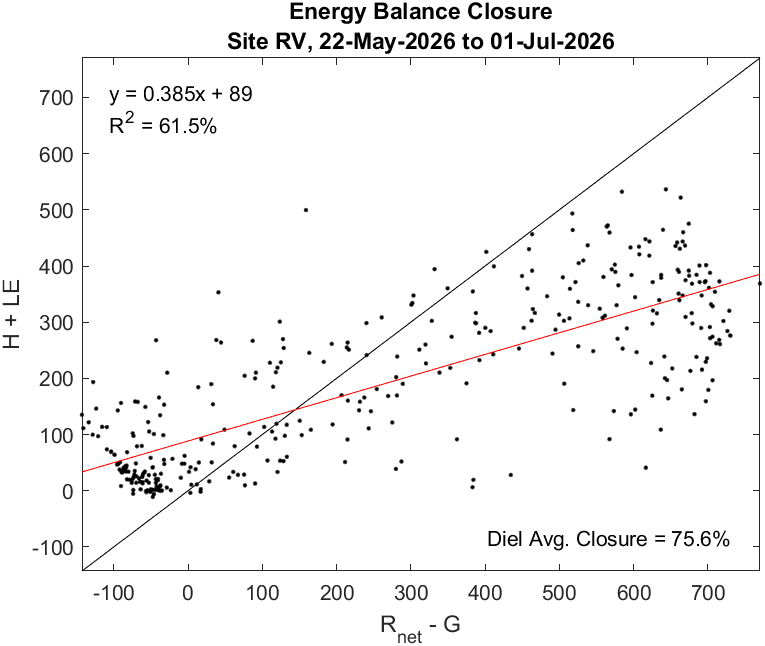
For this period, the EBC is very low (less than 40%!).



Still needs to be checked:
Footprint:
W’ss’ and nighttime CO2 fluxes correlation:
L3

In the last flux processing (20250908) we saw a period where gap filling did not work well. This time, this did not happen.

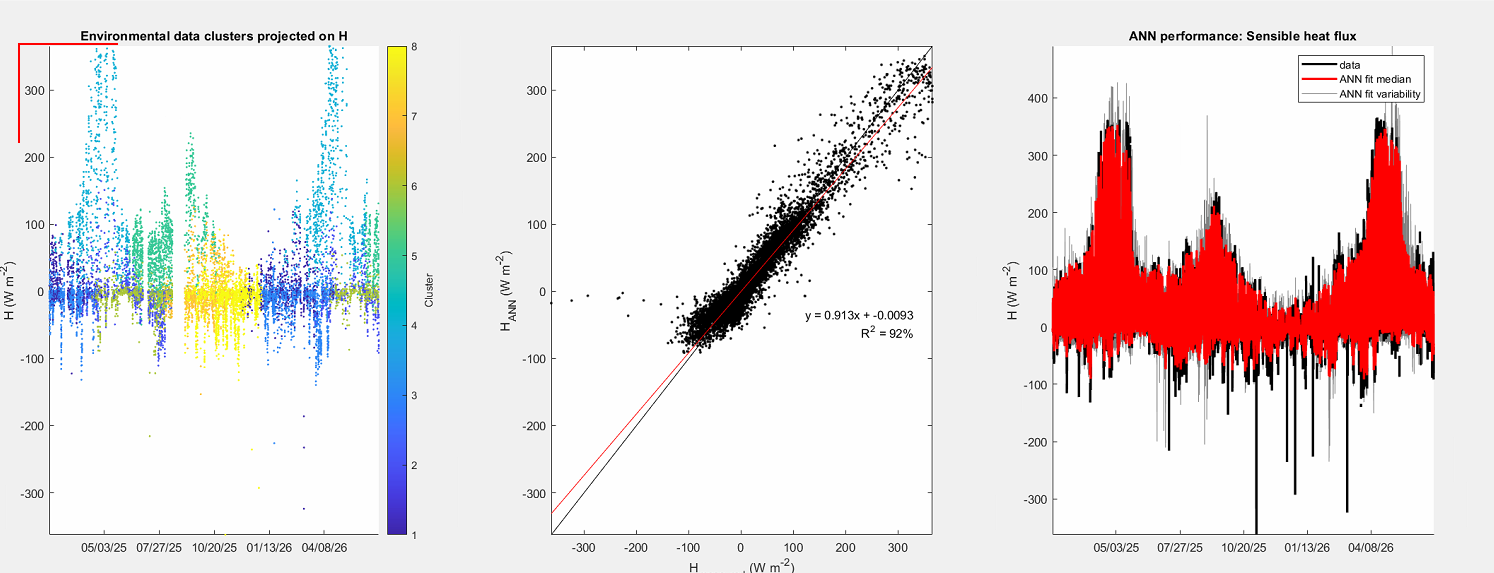
Variables used for wt gap filling: TA_32, Rg, WD, az, ze.
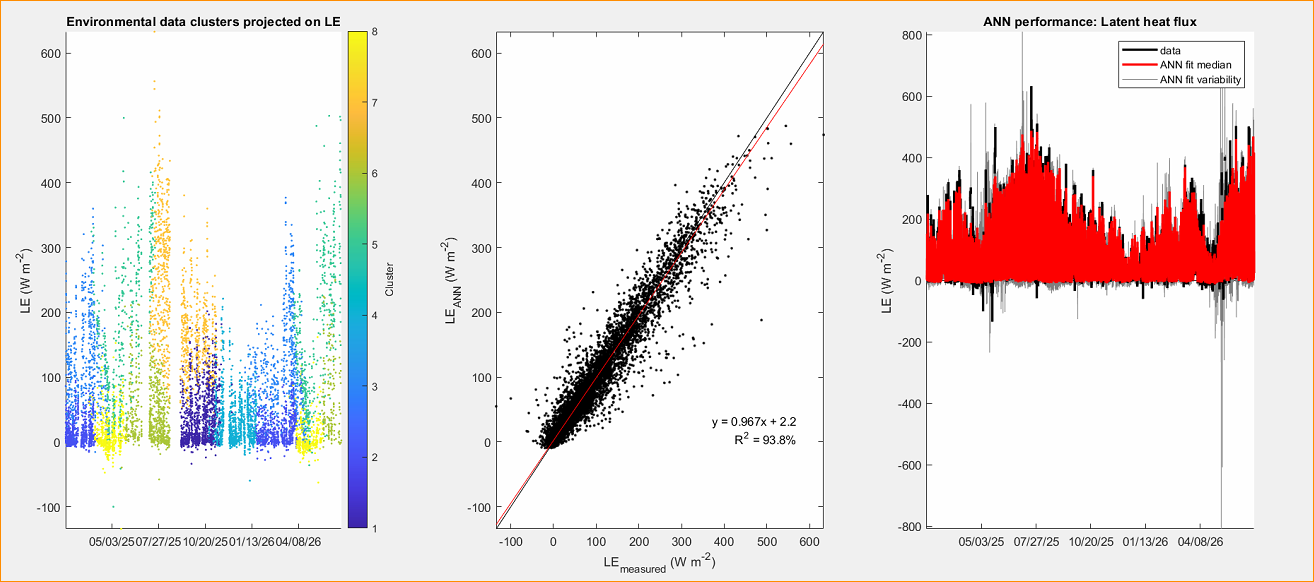
Variables used for wq filling: TA, Rg, Tsoil_2, VPD, ustar, ze.
Variables used for wc filling: PAR, TA, VPD, ustar, az. (night: ta, par, ustar)

Variables used for wm filling: TA, Rlong_in, vpd, ustar, le, wd